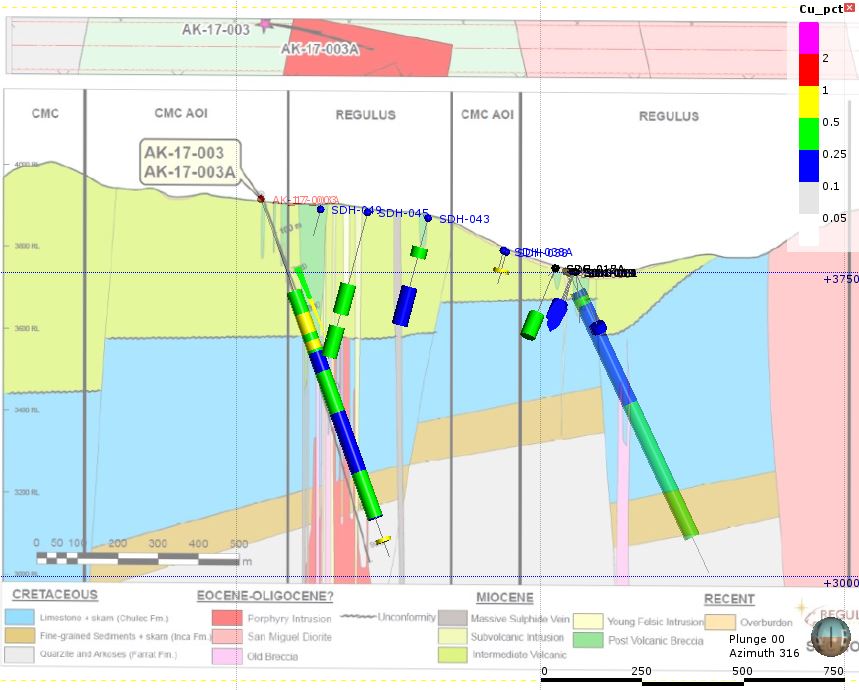
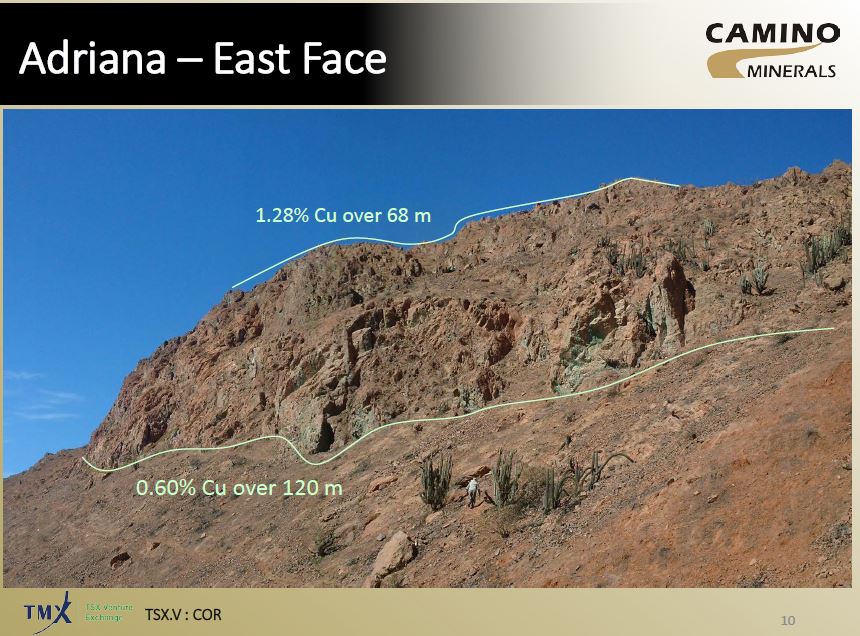
Background blurb:
The original resource for Anta Kori was done waaaaay back in 2012 for South Legacy, but if you read through it, it is very light-weight, we don’t get any information on:- Where the resources are located – not even a simple map
- Where are the open-pitable resource located?
- And the underground resource? Where is it, how will they mine it, from the bottom of the pit?
- No images or sections of the block model showing grade distribution etc.
It is a crap report, a quick and dirty resource calculation. I especially hated the way that they used every metal under the sun to calculate the CuEq grades for the various resource cut-offs.
In essence, it is a crap report.
However, table 14.7 did give a breakdown of the global resources (i.e. not constrained by property boundaries). I wanted to see if I could create a base model from the historic data that could match it, with the idea that I could bring in the recent drilling results and see what happens.
However, I have a big problem:

Look at this table in detail, start with the first row. Write out the total contain metals in full (i.e. including the “0” in the column headings. Do you get:
- 519,541,000 tonnes or ~520Mt that contain
- 4,429,000 lbs of copper – just 4.4Mlbs
- 126,335,000 oz of gold – 126 million ounces of gold
- 3,989,155,000 oz of Silver – just under 4 billion ounces of silver
- 10,598,000 lbs of Moly
- 572,695,000 lbs of Lead
- 2,172,276,000 lbs of Zinc
Damn it, Southern Legacy found South America’s largest gold deposit and second largest silver deposit. Who gives a shit about copper with all that lovely gold and silver.
Unfortunately, as I’m an idiot, I decided to try and work out WTF was going on, brought the data into excel and calculated the amount of contained metal for each element (basically took the tonnage and multiplied it by the grade provided).
And you get….

There are some slight differences:
- ~30% reduction in contained copper (assuming the table was referring to Billions pounds of copper).
- ~45% increase in gold (I have assumed that they put the contained gold under the contained silver column)
- Silver, lead and zinc stay the same (assuming that the contained silver was put under the contained gold column)
- ~80% drop in contained Moly
Generally, very painful news, but the extra couple of million ounces of gold is a nice bonus.
The silly thing is, table 14.5 that splits the resource into Open Pit and underground areas, i.e. the one on Regulus’ website is fine.
WARNING: These guesstimate calculations are complete BS. They are based on grade only, and are designed to give a feel to what Regulus have added to the project.
This is a global guesstimate, I haven't split out mineralization by type, I have assumed everything is the same, which we know is wrong as the high-grade intercepts are restricted to narrow, sub-vertical breccia bodies and veins.
I've included a Leapfrog 3D viewer file here of the various iterations (link)
Notes:
I’ve used the CuEq values, but in the recent drilling these have been calculated from Cu+Au+Ag only, not everything including the kitchen sink as used in the 2012 technical report.
I haven’t factored in mining type, property ownership or recoveries. I’m treating it as a single deposit, calculating the global resources and then clipping it by property boundary to see how much is in Regulus’ concessions..
TAG Guesstimate Global Historic resources

So we get close, I have slightly less tonnes and a slightly smaller CuEq grade (0.48% vs 0.51% from the 2012 technical report).
When we compare the drilling we can see that Regulus have done a lot of work.
Before Regulus:

Regulus:
 |
| lots more copper intercepts |
We see a lot more holes, drilled to much greater depths exploring for the Skarn mineralization that was of secondary interest to Southern Legacy who were mainly focusing on the near surface high-sulfidation gold dominant mineralization.
So, what impact does that have on the project ‘resources’?

Potentially a lot.
WARNING: I've assumed that all the mineralization is the same, I haven't separated by skarn vs HS vs breccia vs vein. It will be an over-estimate.
If we clip it by property boundary:

We see that the majority is on Regulus’ concessions. This is biased by the fact that they can’t report the intercepts that do not occur on their concessions.
However, when we put the global resource figures on the USGS Porphyry Copper chart we see this:

*CuEq figure form the 2012 Technical report, but just using Cu, Au and Ag
If we look at the global resources, the average grade of Anta Kori wasn’t quite good enough. However, if we look at the high-grade (>0.5% CuEq) core of the system, we see that the project changes completely.
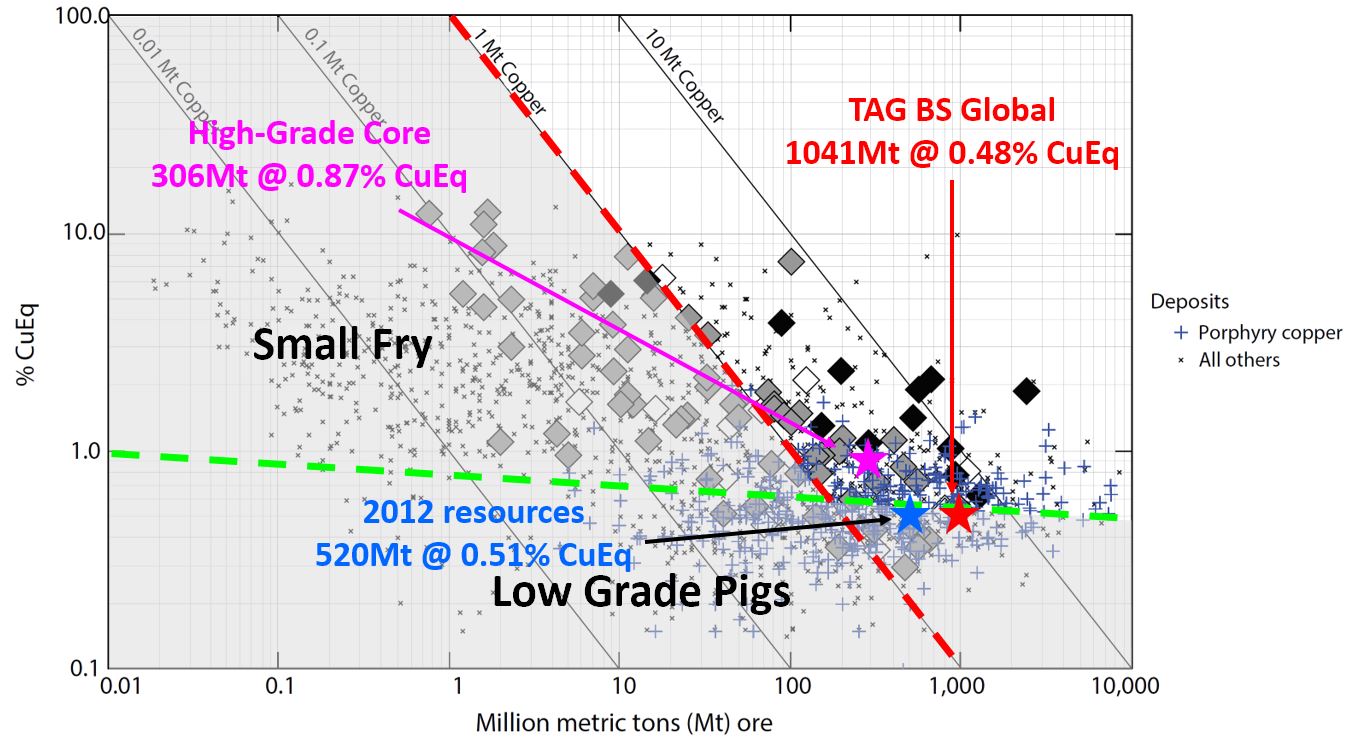
It now sits firmly in the ‘good’ area of the chart.
TL:DR version
Regulus have done a lot of work at Anta Kori that should lead to a decent jump up in resources. The key here is to look beyond the overall tonnage to see how much high-grade (>0.5% CuEq) material they have.
An important question to ask or at least think about is - How will Regulus report their upcoming resources? With the agreement with Coimolache allow them to report a global resource or will they only be able to report the mineralization that occurs on their concessions?
An Observation
On the plan map that accompanies the last PR we see hole AK30 sitting way out to the NW all on its own. Why did Regulus drill such an anti-social hole?

If we look a bit closer we see that the hole starts on Coimolache ground, suggesting that Regulus are still working with the Coimolache permits. This may mean that they still haven’t been granted their own permits to drill in that area.

It looks like the hole is testing the contact between the limestones and porphyry, but without a decent surface geology map to help, it is hard to know why they have been drilling ~500m to the NW of the known mineralization. It is a low risk hole, if it gets something, then they’ll have expanded the footprint significantly, but if it gets nothing, no-one will really care.