Thursday, November 14, 2019

Garibaldi - Feeder

Wow, Garibaldi lots of drill results from Nickel Mountain (link).

Note: I'm going to using NiEq% grades using a ratio of 3.2% Cu = 1% Ni. 
I haven't included any of the other metals as the PGEs, Au and Ag don't always appear to be associated with the massive sulfide intervals and as I don;t know their recoveries, I don't know if an economic amount of the metals will be recovered and paid for by any smelter.

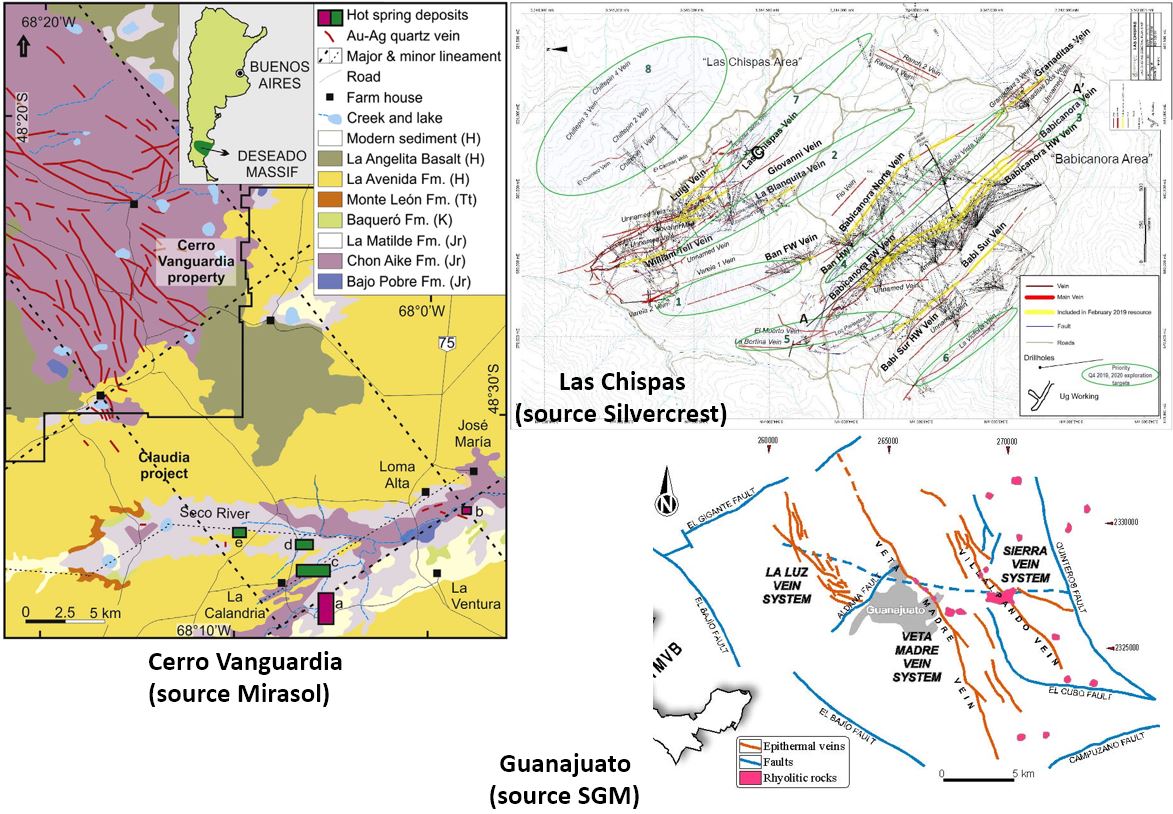
To no surprise, all of the holes are drilled in the same 300m x 200m area that we've all come to love

I added the scale bar
You can get a 3D model from here (link)

Results

Drilling has focused in 3 main areas

  1. NW Zone - Holes EL-19-55 to 61
  2. Discovery Zone - Holes EL-19-51 to 53
  3. Deep Feeder zone - Hole EL-19-54

NW Zone

Seven holes were drilled into this zone to see if the massive sulfides in the NW zone link up with the sulfides mapped at surface in the NE Zone. 


You'll see that the surface sulfides are found at the contact between the E&L Intrusion (purple) and the Hazelton Sediments (light green), 


On the section that the holes generally hit a narrow massive sulfide zone with a small (up to 15m core length) zone of disseminated (<1% NiEq) mineralization above it. Holes 55 and 56 didn't hit any massive sulfides, and suggests that the system is dying to depth in this direction.

Discovery/NE Zones

For the discovery zone I'll write about 2 areas - Upper and Lower sulfide zones


Lower zone = main Discovery massive sulfide zone
Upper zone = small sulfide zone found ~25m above the main zone

Lower Zone

Here is a long section through the lower/main Discovery zone, I've clipped out the spurious information
We an see that hole 54 was a ~20m step-out from the massive sulfides hit in hole 53, and hit nearly 5m of massive sulfides grading 6.5% NiEq.

What is also interesting is that holes 17-12, 18-37 may not have been drilled deep enough to intersect this zone. Maybe there is a (small) chance that Garibaldi could re-enter these holes and drill them an additional 50m to check.

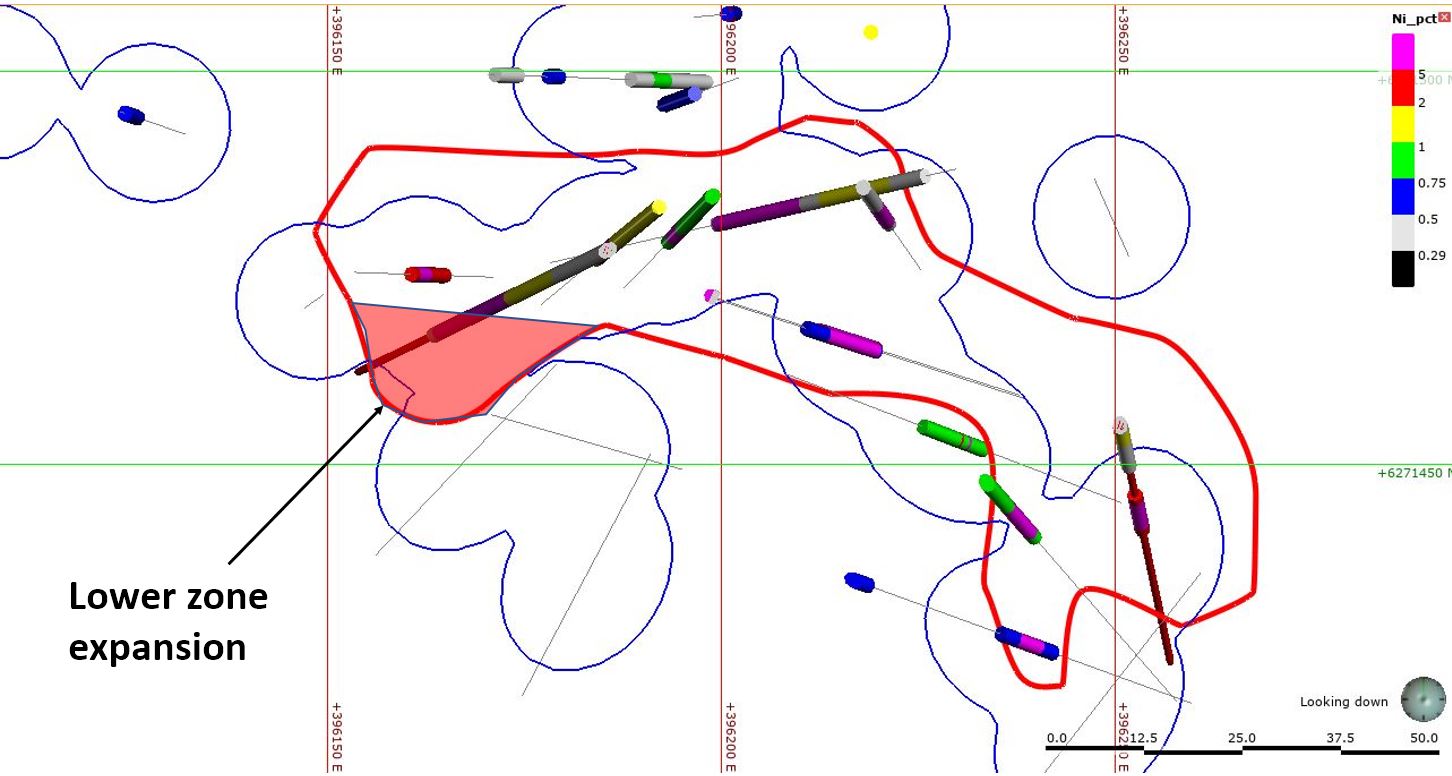
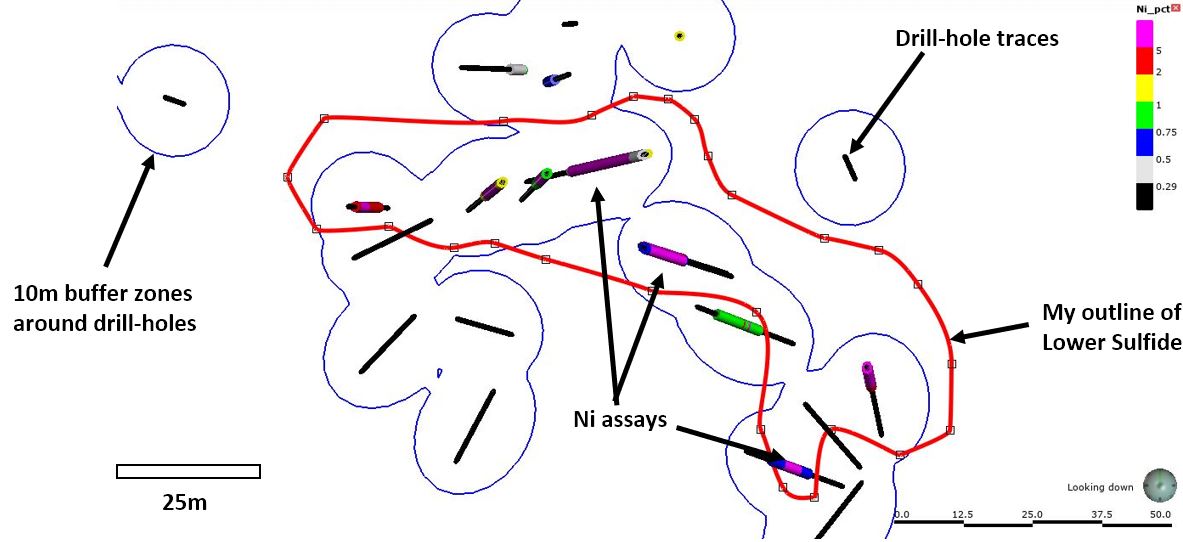
Here is a plan map of the Lower Sulfide zone. It is a busy figure


The known sulfide mineralization i about 130m x 30m and if it is 8m thick, we get:
  • 130 x 30 x 8 x 4.5 = 140,000 tonnes of material
Still very small, to get a 1Mt deposit, at similar thicknesses we need a footprint of
  • 1,000,000 / 4.5 = 220,000 cubic meters
  • 220,000 / 8 = 27,780 m2
  • or a zone that is 30m wide and 930m long (or a strike length that is 7 times longer than the current footprint.
It is small! 

Upper Zone

Drill-hole 51 hit a narrow zone of massive sulfide mineralization ~25m above the Discovery zone. It seems to line up with other massive sulfide occurrences in early drilling.


However, drill-hole 18-24 didn't hit anything on the up-dip continuation of this zone, so suggests that it is a small, localized sulfide body.

Deep Feeder

Hole 54 plunged the depths of Nickel Mountain.

It got a 10m zone of <1% NiEq, but nothing special. This hole was drilled to follow-up on the small zone hit in hole 17-01 (they are ~10m apart). Personally, I think that rather than being a feeder zone, what we may be seeing is the effect of s chunk of Hazelton Group sediments in the Nickel Mountain Gabbros that, due to a change in local chemistry, has led to the local precipitation of sulfides from the gabbros.

We can see on the section accompanying the press release (link) that there is a close spatial relationship between the Hazelton group and mineralization.


However, most of these points are rhetorical, to me, I can't see the evidence from the drilling that supports a big Ni sulfide system at Nickel Mountain.

I did an update to the Officially Bad Resources, make of them as you want


Monday, November 4, 2019

Pretium - coming back to Brucejack

I've ignored Brucejack for ages, but why don't we return to an old favorite.

Since I last put out a post we've had 3 quarters of production and a new resource calculation.

Reserves and Resources

Why don't we compare the Reserves and resources for Valley of the Kings (VoK)*.

Original Dec 2013 resources


Updated April 2019 resources


*the West Zone resources hasn't been updated and isn't the current focus for production.

There are some slight differences

Tonnage


Reserves stayed about the same, M&I resources dropped by 10%, which is isn't much when you see that they mined >1.5Mt of ore (to end of 2018) since the 2013 Feasibility Study. However, we do see a big drop in inferred resources.

Headgrade


This is where things get slightly less polite.


We see a moderate drop in head grade for the Reserves, a slight decrease for M&I resources, but a big drop in inferred grades.

We can't say this is due to Pretium mining high-grade ore in 2018 as the average head-grade for 2017 and 2018 was only 10.1 g/t Au.

Contained Gold

These changes in tonnes and grade have had a big impact on the contained gold.


Even is we take into account that the mine produced ~0.5M oz in 2017 and 2018, that is a massive decrease in resources, they have lost nearly a quarter of the contained gold at Valley of the Kings.

The question is - is the deposit intrinsically hard to model accurately (yes) or was the 2013 model overly optimistic (yes) and didn't fully understand the control and distribution of the gold.

2019 Production

This is easy, production to date is below expectations, even Pretium cut their 2019 outlook from 390K-420K oz Au down to 340K-350K (40K-80K or ~20%), which caused a nice share price collapse.

So why don't we have a look at the wreckage...

Here is the April 2019 LOM grades by year...
We're still in 2019!
Tetratech tell us that Pretium will be mining ore that is 10.6 g/t Au in 2019

Pretium actually mined.....8.9 g/t Au


But they did get better, cranking the grade from 8.7 g/t Au in Q1 to 9.1 g/t Au in Q3.

Awesome job!! Just 1.7 g/t or 16% below expectations.

From their pessimistic production outlook (slashing production by ~60Koz), we can have a go at estimating the Q4 numbers.

We can calculate the planned Q4 production

  • Est. Annual production - 340-350Koz or 345,000 (taking the mid-point)
  • 2019 production to date = 258,168 oz
  • Q4 production = 345,000 - 258,168 = 86,832 oz

We can try and calculate the average head-grade

Assumptions

  1. Mill throughput = 3600 tpd (still ramping up to 3800 tpd)
  2. Recoveries 97%

Tonnes milled = 3600 x 90 = 324,000 tonnes (assuming 2 days of shutdown)
Ounces produced = 86,832 x 1.03 = 89,437 (removing the 3% loss in the mill)

Q4 average head-grade = (89,437 x 31.1)/324,000 = 8.6 g/t Au

Even if Pretium hit the upper end of the estimated production, the grade only increases to 9.1 g/t Au.

The mine is very productive and highly profitable, but it is still under performing, by 10-15%, its new and improved feasibility study, that dropped the grades significantly. What is interesting for me is that since commercial production began, the mine head-grade has sat stubbornly around 9 g/t Au. Is this the 'real' grade of the deposit?

One observation I had in an earlier post was that I was concerned that as the mill was expanded, we would see a drop in head grade.


There is a trend suggesting that, but I think it is a bit too early to tell.

I know this post is a bit negative, but the mine has consistently failed to meet expectations, I know that I will receive a lot of posts saying that the share price is up, but the rise in gold to US$1500/ounce has helped to mask some issues with the mine.


It is still a fantastic mine, and I'm sure that once the issues are resolved, or at least understood, an if gold price keeps creeping up, I would expect a major company to look very hard at buying Pretium.


Friday, October 25, 2019

Westhaven - Shovelnose

I've been wanting to compile the data for Westhaven's Shovelnose deposit for some time. They keep publishing decent grades and thicknesses (link, link and link), and I wanted to see how the data holds together.

Shovelnose is a good exploration story. Work commenced on the property in 2011. In 2016, drilling identified low-grade disseminated mineralization in silicified rhyolites in the Alpine and Tower zones. It was recognized that this could be the upper part of a high-grade epithermal system, which was discovered in 2018.

So, using the previous post on epithermal deposits as a guide, we'll look at the the data to see:
  1. Number of mineralized structures
  2. Size potential - vertical and horizontal extents of the mineralization

Mineralized structures


Westhaven tell us that they have 2 principal veins and maybe splay, but when you put the data in 3D, the picture becomes more complicated.

Red and orange = 2019 DH; green = 2018 DH

However, if you look at the silver, it appears to be restricted to the core of the mineralized structures.

Silver restricted to core of veins


From this I've created a series of veins. It is quite complicated, there are many ways that you can join the dots, but we can see 2 principal structures and several splays and parallel veins.

potentially multiple splay veins between principal structures

We can also see that the thickest and highest grades appear where one of the splays intersects the main vein.

Mineralization Extents

Vertical

Note: My elevations are based on the Government of Canada 50K topomaps (link), and will vary by a few meters from Westhaven's surveyed drill-holes and collars

We know that in LS-Epithermal deposits, the good grade mineralization is restricted to a quite a tight vertical range. In earlier presentations (link), they used to include this slide:

just a 100m extent..

According to their geologists, the decent Au mineralization is found over a ~100m vertical range, from 1250 to 1150, which isn't very special, but with the power of excel, I disagree with them:

Au


Please note - I've clipped the >50 g/t values to show a bit more detail for the <10 g/t Au area.

We can see that the majority of the >3 g/t Au samples fall between 950 and 1200m, and a higher grade (>5 g/t Au) core between 1000 and 1150m.

So we have a 250m apparent vertical extent to mineralization. Not bad

Ag


Please note - I've clipped the >300 g/t values to show a bit more detail for the <50 g/t Ag area.

We see a similar distribution for silver.

Horizontal

I've broken out the horizontal extents by the two principal veins. We want to the extent of the >3 g/t mineralization and if there are any high-grade (>5 g/t Au) zones that are can be extended or infilled (hot holes drive share-prices)

Main Vein


We can see that the majority of the >2.5 g/t samples fall within a specific area that appears to have a 500m horizontal extent and a 100-200m vertical extent.

We can see that the down-dip extension to mineralization appears to be open, but you can see how variable the grades are, we have several holes that hit minimal Au adjacent to hole SN18-25.

Secondary vein


On the second vein we see that the >2.5 g/t zone extends for at least 400m along strike and a 100-120m vertical extent. We can see that the zone appears to be open along strike, so there is good potential to extend this zone. We also see a consistent zone of >5 g/t Au mineralization (~150m x 120m) in the center of the vein.

Conclusions

So far Westhaven have discovered a decent epithernal system, with 2 principal veins with a couple of reasonable sized zones of mineralization. From the long sections we can see that the high-grade (>2.5 g/t Au) zones are well drilled (~50m drill-hole spacing), and the lateral extents appear to limited.

So, where do Westhaven go now? They could continue drilling the known areas and pumping out PRs with decent intercepts, but after a while they'll need to come up with a resource, and from my back of the envelope calculations the current drilling have defined around ~700Kt (assuming an average 2m vein width), which isn't enormous.

Therefore, it is nice to see that Westhaven are looking for new areas (link) to explore to build on their initial discoveries to see if they can find new veins and get the project big enough to attract interest from bigger companies.

You can get my 3D model from here (link)


Friday, October 18, 2019

Low Sulfidation Epithermal deposits

Low Sulfidation (LS) Epithermal drivel 

Just a quick intro on LS-Epithermal vein deposits. Very simple, but there is a reason for this....

911 metallurgist has a great description of low sulfidation epithernal deposits here - link, from which are some important things to note (in general) about low sulfidation (LS) Epithermal deposits and districts:
  • There are often multiple, generally, parallel veins

  • That are associated with (normal) faults. In many districts, often there are blind veins (i.e. the veins don't outcrop on surface).

  • Ore-grade mineralization in a district generally occurs over a specific range*
  • Mineralization isn't distributed equally throughout the vein, but is found in  specific zones (ore-shoots)


*assuming no post-mineral faulting (e.g. San Dimas) or multiple mineralizing/stacked events (e.g. very large epithermal districts e.g. Guanajuato, +/- Valdecanas).

For exploration it is key to target this favorable horizon, as if you
  • Drill above = erratic occasional Au-Ag hits (but could see elevated As, Hg and Sb).
  • Drill below = may hit elevated base metal (Pb, Zn, Cu) grades and low/no Au-Ag (e.g. San Sebastian - Hugh zone (Hecla Mining))

So when you are looking at a company with LS-Epithermal projects you want to see:
  1. Land position - you want the company to control or have a good chunk of a district. There is no point getting to excited about a company with a small project as any decent mineralization will quickly leave the property.
  2. More veins = more potential for large tonnages and multiple ore-shoots (e.g. Las Chispas).
  3. Large vertical extent of high-grade mineralization - this is harder without drilling. Generally in LS-Epithermal deposits the bonanza zone is ~200m thick (bigger systems = larger vertical extents - Santo Nino vein, Fresnillo had a 3-400m vertical extent).

References:
Rhys, D el al  (2017) - Gold’17 – February 2017 – Rotorua, New Zealand 82  l Structure of the Palmarejo Mining District

Friday, September 13, 2019

Quick GGI update

PR from yesterday from Garibaldi (link), and I've updated the Leapfrog model with the results form holes 47 and 53 (link)

now some piccies

Hole 48

This is an infill hole, it is 16m from holes EL-17-09 and 10 and 10m from holes EL-17-14


However, the when we look at the lauded 44.5m at 1.2% Ni and 0.8% Cu we quickly see in reality this wide zone is really running ~0.5% Ni and Cu with the majority of the metals in the ~5m wide massive sulfide zone.


Hole 53


What we predicted, again, the massive sulfide zone was slightly wider than I had doodled in an earlier post.

How do this change the lower zone massive sulfide footprint?

a bunion
Not by much.

So how big is Nickel mountain? Here is my modeled Ni mineralization


Which gives me an approximate size of...


As people got butt-hurt about me comparing Nickel Mountain with Voisey's Bay, here it is compared to a multitude of Nickel deposits (source - link).


So, it isn't, what you would call a tier-1 deposit

Saturday, September 7, 2019

Canadian Topo Maps

Totally irrelevant post, but if you need reasonable topo maps for Canada, the Government of Canada have a great Google Earth link to their Digital elevation models

250K maps (link)


50K maps (link)

even cartographers don't give a shit about the Canadian Arctic
I've found that the best way to download the files is to right-click on the hyperlink and copy and paste it into your browser

Me, working on the Shovelnose property, with my reputation....
This will download a geotiff file for the area selected.

very cool

Thursday, August 22, 2019

Garibaldi - attack of the biscuits

Sorry for my tardiness, I was playing around with copper deposits.

We got a PR from our chums at Garibaldi Resources announcing the first of many few drill results from Nickel Mountain (link)

To the surprise of no-one, we didn’t get any decent maps with this PR, just a couple that re hard to read at the bottom of the PR - I couldn’t see where these new holes were located , could you?

but fear ye not, here they are....

OMG!!!!! both of them have targeted the Swiss Cheese Discovery Zone.

Let’s look at the holes in a bit more detail

Hole EL-19-47

This is drilling the eastern continuation of the lower discovery zone.

That hole was drilled a massive 15m from hole EL-18-16 and 24m from the massive sulfide hit in hole EL-18-24. Not really a massive leap of faith that would add millions and millions of tonnes to the deposit.

EL-19-53

This hole was drilled from the same platform as hole 47 but in a different direction, plunging into the heart of the known


Just 11.3m from the massive sulfides hit in hole EL-18-22


And 14.3m from the massive sulfides in hole EL-18-20…

Warning: the following image contains an “interpretation” involving one or more squiggly lines and maybe words, but definitely no numbers. Please sit down!


What is cool, is that you can join up the massive sulfide hits in several holes to work out an approximate outline of the Discovery Zone.

Isometric view looking SW. Red outline is my interpreted limit to sulfide mineralization
In Plan view, with some annotations and a scale


I added the 10m buffers around the drill-holes as it allows you to quickly see areas they haven't been drilled. 

A lot (20) of holes have penetrated the lower discovery zone defining a zone of massive sulfides that:
  • Dimensions of ~125m long, 15-35m wide and 5-10m thick (true thickness)
  • Or an approximate volume of 23,500 cubic meters
  • Or an approximate tonnage of 108,000 tonnes (using an SG of 4.6*)
*SG of Pentlandite (main Ni sulfide) is 4.6 to 5.0; Chalcopyrite (copper sulfide) is 4.1 to 4.3

So, Nickel Mountains isn't big, but there are a few areas where mineralization can be expanded

dashed green outlines - where mineralization appears to be open


Summary


Nothing new, just a couple of holes pushing the boundaries of mineralization by a metaphorical duck’s fart, and just for fun, here is the Nickel Mountain deposit compared to that tiddler, Voisey’s Bay.


Leapfrog viewer file can be downloaded from here