So I've compiled the data from the Cuale trenches, the Leapfrog viewer file is here (l
ink)
 |
| left = trenches colored by number; right = trench Au assays |
I've drawn on a guesstimate >1 g/t Au contour. We can see that this zone has approximate dimensions of 250m x 125m.
Why don't we focus on the very high-grade part of trench 4
 |
| Welcome to the nugget effect! |
We can see that the ultra-high grade assays in trench 4 aren't repeated in the corresponding/adjacent samples in Trench 1. We can also see that they are less than 5m apart and that ultra-high grade zone is very small (6m x 6m).
We can also see that there are only 4-5 samples containing >30 g/t Au, and in the last post we saw the dramatic effect they had on the overall average grade for Trench 4. If this was drilling data, we would expect a top cut to been applied (here is a great presentation on cutting/capping high-grade samples -
link)
Here is a semi-log graph of the assays - basically we're looking at how many samples (y-axis is frequency) occur within a certain assay range.
For example: In the chart below, the highest bar tells us that 38 samples returned assays between 1.5 and 2 g/t Au.
 |
| We seem to have 2 populations of samples, one centered ~1.5 g/t Au (red dashed curve) and a second at 0.1 g/t Au (blue dashed line). |
So, we can see that we have very few (only 4) above 30 g/t Au, so maybe a 30 g/t top-cut could have been applied. If we do so, this is the impact:
- Trench 4 now returns 106.2m @ 3.74 g/t Au - still good, but a >70% hair-cut
What else can we see? Look at the orientation of the trenches. They have 2 main directions:
- Trench 1 - NE-SW orientation
- Trenches 2, 3, and 4 - NW-SE orientation
Why did Evrim choose those orientations? Are there any clues?
 |
| streams = blue dashed lines |
Have a look at the streams.
 |
| red and blue dashed lines = possible structural trends |
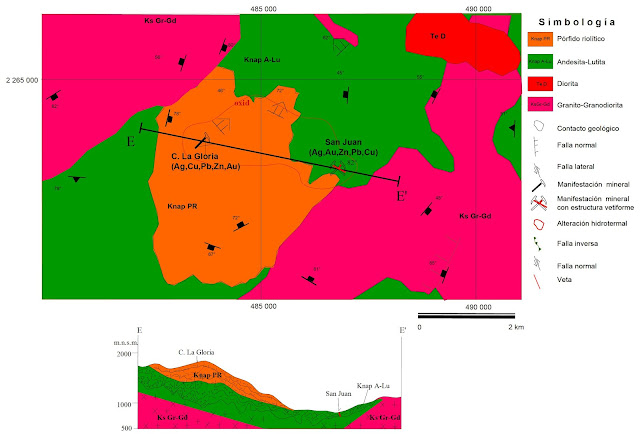
Are there any other clues? Here is the Mexican Geological Survey's (SGM) map of the area (
link). We can see that Cuale is in the La Gloria district.
Have a look at the San Juan Prospect (which I think is within the Evrim mineral concessions). The SGM have mapped an almost vertical NW-SE (125 strike) trending vein, and in the accompanying geological report (
link - in Spanish), we also have a photo
 |
| vein - brown thingy next to the dude, probably a geologist as he is incredibly brave and handsome |
I'm not saying that the mineralization at Cuale (Cerro la Gloria on the SGM map) is exactly the same as in the adjacent San Juan mine, but it gives us some additional information to make a basic, but useful interpretation from the data.
Now we can see that trenches 2, 3 and 4 are highly likely to have been excavated along some structures.
If you want to have some more fun, you can do some indicator kriging back of the envelope calculations to have a high quality resource calculation guess at contained gold.
- Dimensions > 1 g/t Zone = 200m x 120m x 100m (depth extent)
- Specific gravity - 2.8 tonnes/m3
- Average grade = 1.5 g/t Au
Tonnage = 200 x 120 x 100 x 3 ~ 7.2Mt
Contained gold = 7,200,000 x (1.5/31.1) ~ 350Koz Au
These numbers are complete BS, but can be an interesting guide to potential size. Fingers crossed that they get massive thick intercepts of >1 g/t Au!


