Thursday, August 22, 2019

Garibaldi - attack of the biscuits

Sorry for my tardiness, I was playing around with copper deposits.

We got a PR from our chums at Garibaldi Resources announcing the first of many few drill results from Nickel Mountain (link)

To the surprise of no-one, we didn’t get any decent maps with this PR, just a couple that re hard to read at the bottom of the PR - I couldn’t see where these new holes were located , could you?

but fear ye not, here they are....

OMG!!!!! both of them have targeted the Swiss Cheese Discovery Zone.

Let’s look at the holes in a bit more detail

Hole EL-19-47

This is drilling the eastern continuation of the lower discovery zone.

That hole was drilled a massive 15m from hole EL-18-16 and 24m from the massive sulfide hit in hole EL-18-24. Not really a massive leap of faith that would add millions and millions of tonnes to the deposit.

EL-19-53

This hole was drilled from the same platform as hole 47 but in a different direction, plunging into the heart of the known


Just 11.3m from the massive sulfides hit in hole EL-18-22


And 14.3m from the massive sulfides in hole EL-18-20…

Warning: the following image contains an “interpretation” involving one or more squiggly lines and maybe words, but definitely no numbers. Please sit down!


What is cool, is that you can join up the massive sulfide hits in several holes to work out an approximate outline of the Discovery Zone.

Isometric view looking SW. Red outline is my interpreted limit to sulfide mineralization
In Plan view, with some annotations and a scale
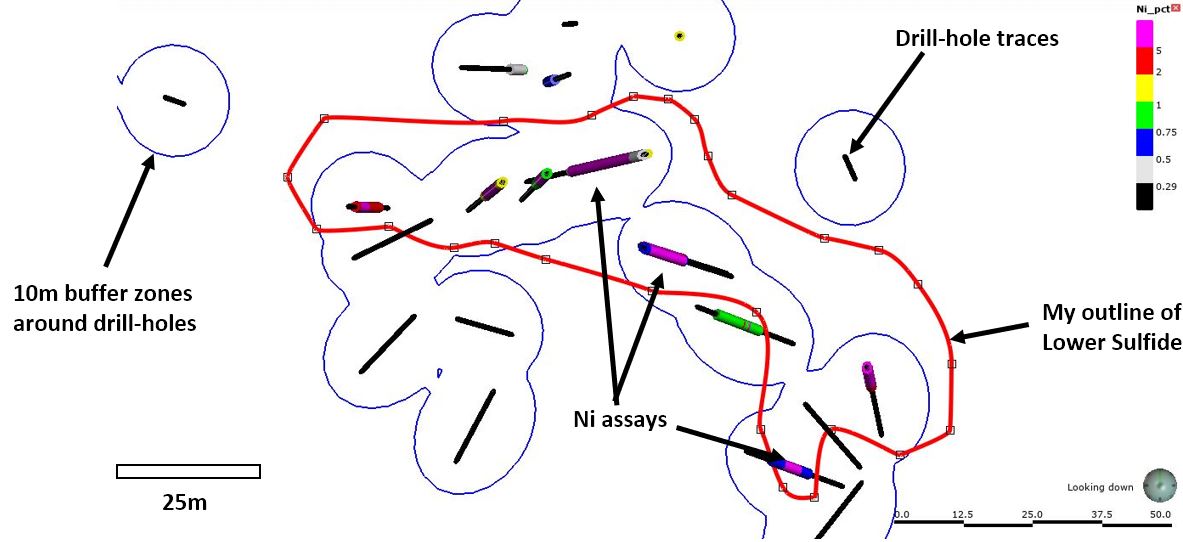


I added the 10m buffers around the drill-holes as it allows you to quickly see areas they haven't been drilled. 

A lot (20) of holes have penetrated the lower discovery zone defining a zone of massive sulfides that:
  • Dimensions of ~125m long, 15-35m wide and 5-10m thick (true thickness)
  • Or an approximate volume of 23,500 cubic meters
  • Or an approximate tonnage of 108,000 tonnes (using an SG of 4.6*)
*SG of Pentlandite (main Ni sulfide) is 4.6 to 5.0; Chalcopyrite (copper sulfide) is 4.1 to 4.3

So, Nickel Mountains isn't big, but there are a few areas where mineralization can be expanded

dashed green outlines - where mineralization appears to be open


Summary


Nothing new, just a couple of holes pushing the boundaries of mineralization by a metaphorical duck’s fart, and just for fun, here is the Nickel Mountain deposit compared to that tiddler, Voisey’s Bay.


Leapfrog viewer file can be downloaded from here

Friday, August 16, 2019

Cu Acquisitions

I had a chuckle at Cordoba’s PR (link) on their resources, it is quite small, and spread over several deposits, but it made me think….

How good does a porphyry copper deposit need to be to give a massive erection to a mining executive and make them splash their wodge to buy it?

Fortunately, Oroco Resources had included a nice slide in their presentation (link), that I was able to use.

Assumptions:
  • CuEq derived from Cu and Au, the other metals don’t generate much value
  • 100% recovery
  • Metal prices of:
    • Cu = US$2.50/lb
    • Au = US$1250/oz
    • Ag = no-one gives a shit about this
Magenta = San Matias
Quite a spread, please note that I haven’t separated producing mines from development projects, and many of the largest deposits will have a high-grade core/starter pit (e.g. Cobre Panama), but you can clearly see that all bar one (El Pilar in Mexico) contained >1Mt copper.

So, plot on your favorite Cu project to see where it is, as companies don't appear to be very choosy with what they buy,.

In my opinion, we can see that lots of these projects are too low grade (<0.5% Cu) for development, but it seems that the only thing that matters is size.

I’m sure it is more technical than that, but it is an interesting guide to have a look to see is out there, and when copper starts raging, the FOMO will be strong and lots of stupid strategic acquisitions will be made and hopefully you’ll make out like bandits.

Monday, July 8, 2019

Pause

Sorry for the lack of posts, I've been working on a large project that has been consuming all of my time.

It is now complete-ish, so I have some time to waste on this blog!

Buritica - Narrow veins and potential issues

Continental Gold have been releasing some juicy assay data from Buriticá, here is an example from last month (link).


I hate companies that report strike length samples, to me they are trying to deceive you into misreading the table and believing that they have wide zones of gold mineralization:
  • e.g. 31m @ 24.09 g/t Au and 76.22 g/t Ag at 2.26m width
translates to:
  • A series of samples taken from a vein where a 31m long portion averaged 24.09 g/t Au and 7.66 g/t Ag over an average width of 2.26m 

However, what interested me most about this PR were the maps and this statement:


In Summary:
  • No capping
  • Weighted averages
  • No dilution
The issue with no using capping and using a weighted average is that a few high-grade samples can increase the overall average of the mineralized zone lead to companies calculating resource blocks with higher grades than actually occur. This is especially problematic this methodology continues through to mine development (this often happens when companies do resource calculations internally), when they get into a situation where reserve/resource grades >> mined grades (e.g. several mines operated by First Majestic).

I’m using the maps from the March 9th PR (link) as they give a breakdown for each channel sample compared to just a series of colored rectangles used in later PRs.


We’ll focus on the areas YR_1444_CX05 - Stope Areas 1 and 2 – I’ve added a grade legend as the one on the original maps is quite hard to read.


We know that Continental plan to mine all of this vein in this area as they have them shown as potential stopes, but if you look closely at this map you see 2 things:

1. Grade

The average weighted, uncapped grade for this area = 16.95 g/t Au, or red according to the grade legend, so:
  • How many samples are red (or better) from this section?
    • 7 out of 26 or 27% assayed >10 g/t Au or
    • 73% of the channel samples assayed less than 10 g/t Au
In high-grade gold mine you get a lot of variability, but it would be reasonable to expect that the modal value would be close to the reported average grade of this area? Let us look closer at the map.

At the far west end of the “2” stope area, we see an ultra-high-grade sample (cyan rectangle) that is grading 2.26m @ 119.6 g/t Au, what would happen to the average grade for the entire block if we remove this sample?
    • Grade drops from 16.95 g/t Au to 9.11 g/t Au, or by 46%
Typically mining companies cap ultra-high-grade samples to avoid this issue, where a couple of high-grade samples can significantly increase the overall grade of a zone, we'll do the same here:
  • Uncapped – 2.23m @ 16.95 g/t Au over a 78m strike length
  • 50 g/t Au Cap – 2.23m @ 11.08 g/t Au – a 35% reduction
  • 30 g/t Au Cap – 2.23m @ 9.72 g/t Au – a 43% reduction
A ‘traditional’ way that resources were calculated in underground mines (some mines still use this method (link)), is that they extended the mineralization above and below the level by a distance equal to half-strike length, so for this area we can guesstimate the contained gold for the 2 stopes and see the impact of applying a cap:

Assumptions
  • Strike length = 78m
  • Vertical extent = 78m (39m above and 39m below the level)
  • Average width = 2.23m
  • Tonnage factor/specific gravity = 3.13 t/m3 (from 2019 technical report – table 11.1)

Guesstimate contained gold:
  • Uncapped = 21,150 oz
  • 50 g/t Au cap = contained ounces drop to 15,128 oz
  • 30 g/t Au Cap = Au decreases to 12,273 oz Au
Just applying a small cap, we've reduced the average grade and therefore the contained gold by a lot.

You can clearly see the impact that a few high-grade samples can have! This is why companies apply a cap, it makes the results less sexy, but is important, as if you don't, you can start to include a lot of waste with the ore and it works it way into the mine plan, which looks like it is happening here as we can see that the limits of the stopes (the black lines) include everything, including marginal (yellow) and waste (green, grey and white) portions of the vein.

Essentially, based on the channel samples gold grade distribution in the stope is more like this:


We have some narrow high-grade zones (red), a large waste zone in the middle (green) and the majority of the block is low grade (orange) or marginal (yellow), which is <<16.95 g/t Au as originally advertised in the PR.

Why is this an issue? We can see that using a weighted average can skew the grade significantly (in this case by up to 40%), and in several mines that I know, they continue to use this 'traditional method' to define resources and zones to be mined.

A couple of high-grade samples/drill-holes can quickly add a chunk of mathematical resources that are have significantly higher grades than reality leading to large ares of sub-economic or marginal blocks being included in the resources and eventually mined.

This results in lower than expected head grades, lower gold production, lower revenues, higher per ounce production costs and reduced profits.

These are all things that shareholders love.

How many mines do you know where grades haven't met expectations or feasibility studies?

2. Vein widths

One thing that I found amusing was that all the samples thicknesses range from 2.06 to 2.27m. Remarkably consistent!

However, when you look at the level plans, you see:


That the vein is represented by a very thin red line, that is significantly narrower than the channel sample rectangles. That is the vein...

Here is a photo from the Fire Creek Mine in Nevada. 


See how they are not just sampling the vein, but the surrounding country rock (this is standard practice, you want to know the grade of everything you will be mining). In this photo the vein is ~90cm wide, and we can see that they are sampling ~1.5m either side of the vein, or a total channel sample width of ~3m. We can also see that a separate sample was taken from the small vein on the left. This is standard sampling practice.

So, if Continental are doing something similar, we would expect that they are sampling the vein, and 1m either side, which indicates that the vein is actually 5-27cm wide, which is similar to the drilled vein thicknesses (link).


High-grade but narrow, with a bit of gold in the country rock around the vein

Why is this an issue? Well in narrow vein mines, controlling dilution is critical, if you have excessive dilution, you will have:
  • difficulty in maintaining a consistent head-grade
  • difficulty in using modern mining equipment
  • low production rates
You can use highly selective mining methods (e.g. Resue (link)), but they have low production rates. You can increase production by either using mechanized methods (increase dilution), or extracting ore from many heading (increased labor costs)

If you have a large mill, you need to mine a lot of material and therefore you can't be very selective be very selective. At Buritica, the mining width (based on the width of the mine level) appears to be ~2.5m, whereas the the vein widths (in this section of the mine)  around 0.25m, so you already have massive dilution.

Minor changes in thickness of the vein or the inability to minimize mining widths and therefore minimize dilution can cascade through an operation, significantly impacting mine production and profitability.

How many mines have you read about that have had issues with grade control, or throughput?

We've see with Pretium at Brucejack where initial resource and reserve calculations appear to have struggled with accurately re-conciliating head-grades to estimated reserve/resource grades, that led to them implement a new comprehensive grade control program (with associated costs) to try and better understand the gold distribution.

I'm not saying that the same is happening at Buriticá, but history rhymes, we have a situation where a company wants to mine a series of narrow, high-grade veins and some of the PRs (obviosuly promotional in the way that the data is shows) appears to suggest that several areas could have significantly different grades as thought.

As we have seen at Brucejack (and several other underground mines), there is a desire to define as large a resource as possible, and as quickly as possible, which can lead to the situation where mine plans, scale of mining, are being advanced before the true nature of gold distribution in the veins is properly understood.


Monday, May 6, 2019

Chakana Copper

We've been getting a few eye-watering drill results from Chakana Copper (link and link) from their various breccia pipes, which has led to them snagging Goldfields into pumping a chunk of change into the company (link).

I've been casually following them and Soledad and I've always though that the breccia pipes are very small, and if there is a porphyry on the project, it would be too deep to do anything with.

So, I've finally managed to compiling the data into leapfrog (link).

We can see that Chakana have drilled 25Km of drilling but appear to have 4 of the ~27 breccias identified so far on the project.

Breccias everywhere
If we look a bit closer at the pipes....


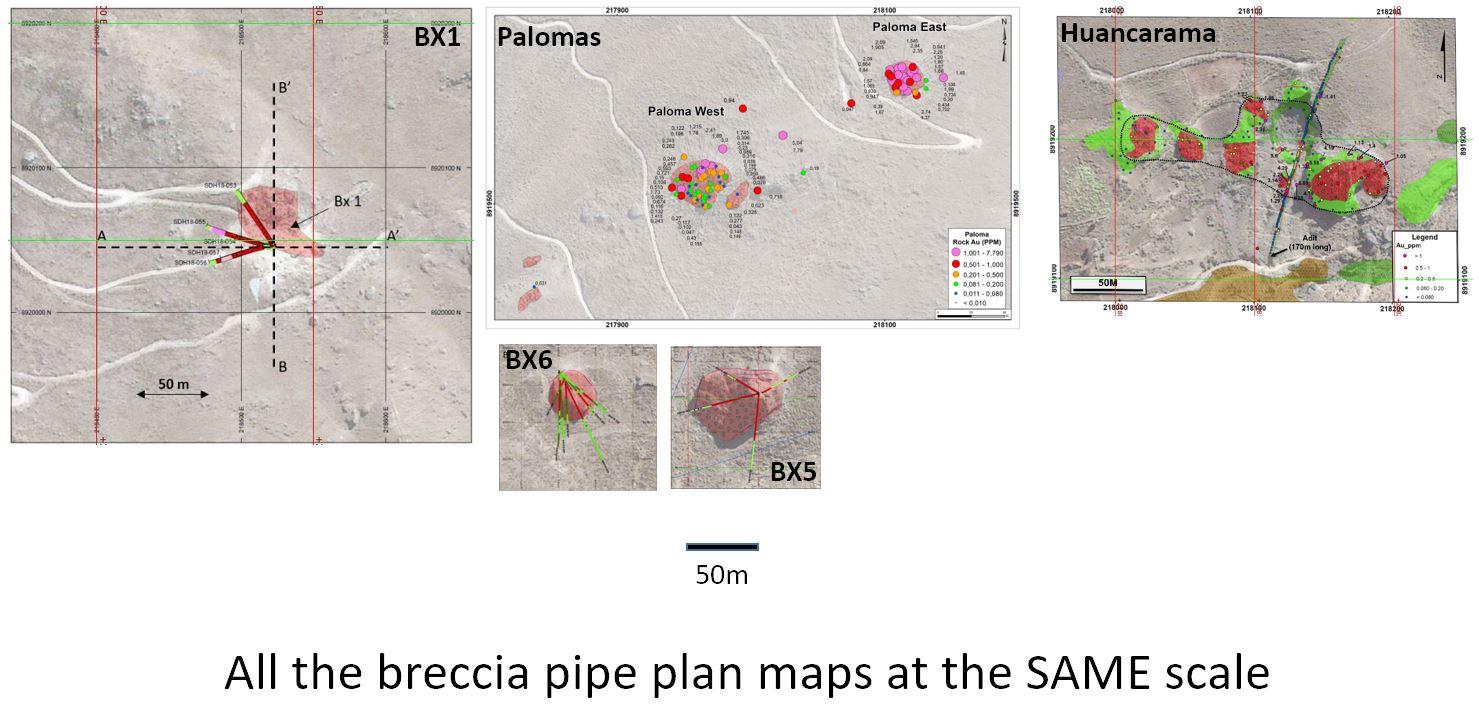
Essentially the breccia pipes are very, very small, typically with a 50m x 50m surface expression, based on the 5 breccias that we have maps for.

BX1

This has received the most drilling and has produced the best results.


We can see that lots and lots of holes have been drilled down the guts of the BX1. However, unlike BX5 and 6 below, a few of the holes intersected a blind breccia body to the SW.

It also appears the the grades are decreasing with depth, but this may be a result of the holes leaving the breccias and drilling country rocks, but we can clearly see, the breccia body is small (75m x 25m with 300m vertical extent - of the >2% CuEq mineralization), but high-grade.


BX5


More drilling down the guts of the system, it is 50m x 50m, and has been drilled to 200m depth. It is lower grade than BX1, but consistently over 1% Cu. However, I'm not sure that this is good enough for a body that will be mined from underground, it may need to be >2% to be viable.

BX6


BX6 is another small breccia body, with more drilling down the middle. We have a high-grade (>3% CuEq) close to surface (supergene enrichment), before the hole pass into moderate grade breccias below. Nothing special here


I'm going to stick with my original opinions, even though BX1 shows that there are additional breccias that don't reach surface, I'm not convinced that Chakana will be able to define a significant resource at the project. They have enough drilling into the BX1, BX5 and BX6 breccias to give the market something, but my back of the envelope notes come up with ~2Mt, which isn't very much.


I can understand them flogging the porphyry potential. This is a valid model, but on their own sections they suggest that any porphyry body will be very deep and essentially unexplorable.

However, they have money from Goldfields, and would like them to move away from BX1 and drill a few holes into 5-10 different breccias to see they have other high-grade breccias similar to BX1 (e.g. Faro and Corral in the Western Breccia zone).


Unless they find something amazing, and demonstrate that they can find enough breccias to define ~5Mt of material grading >2% CuEq, I don't see much value in the project on its own. However, with Hercules next door, could there be potential synergies with Lincuna? If the breccia bodies could be mined profitably from underground, maybe Lincuna would like some highly profitable ore to process (as long as it isn't too expensive to add a copper circuit to their mill)?

Saturday, April 13, 2019

Pretium - Lies, damn lies and Reserves

I've been bashing Brucejack frequently over the 'difference' been mine grade and reserve grade, and with the release of the update resource and resource statement, I decided to look at how the reserves and resources have changed overtime (just for the VoK):

Note: I've added dashed lines to the charts where data is missing (the Dec 2016 resource press release didn't include information for M&I and inferred resources).

Tonnes


We can see that that we had an initial increase in resources from 2011 to 2013 and then a leveling off as drilling focused on improving resource quality and converting resources to reserves. We see that recently drilling has also focused on increasing resources.


Contained Ounces


Ounces have stayed relatively flt over time, we had very large growth in resources from 2011 to mid-2012, then the focus has been on improving the quality of the resources (from Inferred to Measured and indicated) and to reserves in 2016.

Average Grade


I've added a lines for the Life of mine (LOM) mine grades in the 2014 Feasibility Study (FS - orange line) and the new 2019 proposed mine grade (purple line), and one for the 2018 actual mine head grade (grey dashed line).

  • Average grade (all resources) decreased from 22 g/t Au (2012) to 15.8 g/t Au (2019)
  • M&I resources remained constant since 2012 at ~17.1 g/t Au
  • Inferred resources decreased from 35 g/t Au (2012) to 17.7 g/t Au (2019)
  • Reserve grade decreased from 16.1 g/t Au to 13.8 g/t Au
Obviously the reserve and resource grades have dropped because of all the high-grade mineralization mined in 2018......


You will see that in many 43-101 reports the Inferred resources typically higher grade than the other resource categories, they are normally based on the lowest quality data (relatively speaking), the widest spaced drill-holes and can be heavily skewed by a few ultra high-grade holes. However, it is surprising that the grade of the inferred resources have fallen by such a large amount.

This figure was also interesting in the press release:


There was a lot of technical crap in the section accompanying this table, but in I think it means they mined 20% more material than planned, now this will be interesting to see going forward, especially with the mine being expanded to 3800 tonnes per day.

Brucejack produces a lot of gold, but it keeps falling short.

Data for these charts came from:

Feb 2011 resources - link

Nov 2011 resources - link

Apr 2012 resources - link

Sept 2012 resources - link

Nov 2012 resources - link

Dec 2013 resources - link

July 2016 resources - link

Dec 2016 reserves - link

Apr 2019 reserves and resources  - link