Showing posts with label Nevada. Show all posts

Friday, July 28, 2017

Newrange gold - Pamlico

There have been several spectacular drill results released by Newrange Gold Corp from their recently acquired Pamlico project in Nevada.

June 19th (link)

fap

July 7th (link)

fap fap fap fap fap fap

Some cock-stiffening intercepts, and Newrange have nicely included some geo-porn

This picture was sponsored by Vaseline for dry and sensitive skin....
BTW - did you take that photo 4 years ago or forgot to change the time on that fancy new camera? It is true the ideas of march were unlucky in 44BC....

Summary


  • Massive grade smearing, gold is found in high-grade structures
  • No strong evidence for a large disseminated deposit.
    • Small areas of disseminated mineralization mineralization found where multiple structures intersect. 
  • Poor drill program execution - no real testing of structures, drilling appears almost random
  • RC drilling in a narrow structure gold deposit = cheap and nasty. Important controls on mineralization may be very hard to determine from small rock fragments.
  • RC drilling can also lead to significant grade smearing if not conducted carefully.
  • Next to the western hemisphere's largest munition storage facility
    • Negative: US military may not like explosives being next to its dumps
    • Positive: May be able to get cheap explosives
  • There has been significant prospecting around the project, there could be a chance to develop several several small high-grade zones into a moderate sized resource.


Rock Rant

I'm very disappointed with the drilling. Newrange are using RC drilling to explore the project. I understand that it is quick and most importantly, cheap, but you end up losing so much information.

The holes appear to be almost randomly orientated - what are they actually trying to drill?

They have the mapping and sampling from the ramp that identified 2-3 gold bearing structures.

red dashed line = traces of structures in the ramp
Why didn't they follow those along strike to see where they go? It looks like they have been very lucky, or do we have a forgiving, disseminated gold deposit?

Let us put the data through the de-intervalator:

ta daaaaaa!

Newrange have done a David Copperfield! All that beautiful gold has disappeared. Why?

You've guessed it, we have some beautiful examples of grade smearing. I would hate for a nEwsletter wrIter to have been confused by the press releases and think that there was potential for a high-grade disseminated deposit!

That big green hole is hole 17, my favorite:

  • We go from: 70.89m @ 3.57 g/t Au
  • To: 65.54m @ 0.396 g/t Au surrounding a couple of high-grade zones running
    • 4.58m @ 48.3 g/t Au
    • 0.76m @ 35.4 g/t Au

Note: 0.396 g/t Au = Waste (unless you're Coeur, when it represents a 'buying opportunity')

So to put it bluntly - 89% of the gold in 7.5% of the rock. No disseminated potential here, but it isn't all bad news, they have a ramp going into that zone, and so I wanted to understand the controls on mineralization.

Pam's varicose veins

From this I built a vein model to see if the thick hits were from wide, high-grade veins or some luck from drilling down the vein (so a wide apparent width). The veins were modeled by projecting the information mapped in the decline and linking them up with assays along strike.

Plan view 


So we have 3 principal veins

Holes drilled sub-parallel to veins = long intercepts!

The cool thing is, when you bring all those veins together, you get this:

Red box = area of thick >1 g/t Au intercepts


By building up a decent 3D model you can start to see how the pieces fit together. There is a small zone of >1 g/t disseminated mineralization where the 3 structures come together. The nice thing is that it is close to the ramp, which provide Newrange the potential to define a small tonnage "bulk sample" that they could extract and process to generate some news and maybe some loot.

Here is my Palmico model (link)

highest gold values where the veins come together, that's original
Sometimes you can do cool stuff when working in 3D and I feel that many exploration companies are missing a trick if they stay in Flatland (ask A Square) when looking at the exploration data.

District potential

This is what is interesting about Pamlico. in the initial drilling there hasn't been much evidence to support a large, disseminated deposit, but with careful, focus drilling (with a fecking core rig) Newrange may be able to define several small, high-grade zones that could hypothetically feed a small operation.

If you look at the entire district (and I am assuming that Newrange has most of it), you can see:

a metric feck tonne of veins

There are heaps of workings, following veins/structures for >1km along strike. There could be many, small high-grade zones there.


Tuesday, November 1, 2016

Nevada Zinc - not all Zinc deposits are equal

My chum down south has been beating the drum recently about Tinka and their base metal project in Peru and showing us lots of lovely charts about how zinc prices have been shooting up. So, I took his advice and bought shares in Teck....

I can't see a difference.....
So I thought I would try and be clever and went looking for companies with zinc projects, and I stumbled on Nevada Zinc (link), they have been hitting some great zinc intercepts from their Lone Mountain project in Nevada.

I thought, at last I've found a decent project that no-one knows about, but a crap load of shares and wait for the retail investors to pile in and make me rich (ok, being realistic - slightly less poor).

I brought the drill-data into 3D (you can get the model from here).

look at those grades....

magnificent, thick, juicy zinc intercepts
Everything was looking good until I saw this in their presentation (slide 16) where it states: "Potential for sulfide mineralization at depth"

Crap, we have a zinc carbonate deposit. How many of those are operating around the world? I only know of one - the Skorpion Mine Namibia (link), that produces around 125Kt of zinc metal a year from a alluvial zinc deposit.

All other carbonate zinc deposits I know are hosted in limestone:
  • Accha and Yanque in Peru (Zincore Metals Inc (link))
  • Sierra Mojada in Mexico (Silver Bull Resources (link))
  • The tops of zinc deposits (e.g. Tsumeb, Broken Hill and the MVT deposits in the USA, UK and Ireland that were mined in the 18th century,
So they aren't common, but Skorpion is/was the 8th largest zinc mine in the world, that is good, no?

Skorpion is a bit different, most non-sulfide zinc mines are generally found in limestones, and you know what happens when you tip a load on acid on them, they fizz. Hypothetically you can leach the zinc minerals, but will have massive acid consumption.
Don't worry, Nevada zinc state that they can use dense media separation (DMS) to remove a lot of the waste and they they can leach the zinc, but that is the big issue, the real elephant in the room is the lead.

There is a bit of lead...
There isn't much, but lead carbonate, so what's the problem? Well lead carbonate is romantically called "white lead" and for the older readers it was used as a pigment in paint. Those of you who are or have renovated an old house, you know what a hemorrhoid it is to remove and dispose of the old paint.

This is what Wikipedia tells us:

It tended to cause lead poisoning, and its use has been banned in most countries...

So why is mining lead carbonate bad? Why don't we ask Magellen Metals what they think (link)?

Magellen (now called Rosslyn Hill Mining) operated the Wiluna Mine in Western Australia (link). A oxide lead-zinc deposit. Back in 2006 it was noticed that ~9000 birds died in the town of Esperance, that was discovered to be caused by lead poisoning. The source of the lead was the concentrate from the Wiluna mine that was using the port at Esperance to ship the concentrate overseas.

They also found that 10% (about 1400 people) have blood Pb levels above WHO levels. The concentrate contained lead carbonate which is absorbed much more easily that lead sulfide. The end result was that they had to pay AU$30M to clean up Esperance, and were very much under the microscope from the state government. the mine is currently closed.

So, Nevada Zinc have a carbonate zinc deposit in the USA, a country well know for being incredibly environmentally friendly. Imagine the fun you'll have with the EPA over:
  • Mining ore with lead carbonate - you gonna need good dust control
  • Transporting concentrate with lead carbonate in it
  • Having waste dumps on surface that may contain lead carbonate
    • they don't have any wind in Nevada?
I'm surprised they haven;t had a slap on the wrist for doing RC drilling, which looks like this...


Bit like a steam train, puffing all that dust over the desert. Imagine that dust contained something nasty.....

So in essence, not all zinc deposits are created equally, and if you see a company talking about their great oxide zinc depoist (e.g. Zincore, Silver Bull, Nevada Zinc), just ignore them and move on.


Darkstar - Don't give me any of that intelligent life crap, just give me something I can blow up?

Gold Standard have been releasing some decent new hits from North Dark Star over the last couple of months, and so I cajoled (thanks Rob) into revisiting the project to see where these holes were drilled and to see what is new.

My updated model can be found here (link) and I've also uploaded the drill-hole data as well (link).

Summary

TAG's officially bad BoTE (back of the envelope) resource calculation for North Dark Star is: 
  • 43.7Mt @ 0.78 g/t Au or
  • 1.1 Moz Au
Basically this is a small, moderate grade deposit which is similar to the others they have found around the project:
  1. Pinion - 1.7Moz Au (92 Mt @ 0.58 g/t Au
  2. Dark Star - 0.38Moz Au (23Mt @ 0.51 g/t Au)
Is there potential for Railroad to host a big gold deposit? It is possible, but the drilling is telling us that in reality, there are probably just a few small deposits like NDS scattered around.


Why don't we have a look at the recent drilling in a bit more detail. 

If you ignore holes 07 and 10, all they are hitting are narrow, low grade zones.
We can quickly see (heck they draw lines to them) where the good holes are located! They are all drilled into that nice yellowy-pink blob, and all the crap holes (narrow low grade zones or no mineralisation) are located around it, and all of their holes exploring the South Dark Star corridor found diddly squat!

Let's look at the sections - going from north to south

Section 4480200N

Hole DS16-01 - very disappointing
Hole DS15-10, 11 and 13 all hit zone high high grade mineralisation (again these 3 holes are only 40m apart) but as soon as we move away from the core zone, the grade disappears. Look at hole 16-01 - just a few narrow, low grade zones and it is only 30m from 150m @ 1.4 g/t Au! 

Section 4480080N

Same again, high grade (>1g/t Au) core that quickly dies out
DS16-08 hit a nice thick gold zone and this has continued down to hole DS16-24, but up-dip the story is totally different, hole DS16-21 drilled just 60m away hit precisely SFA.

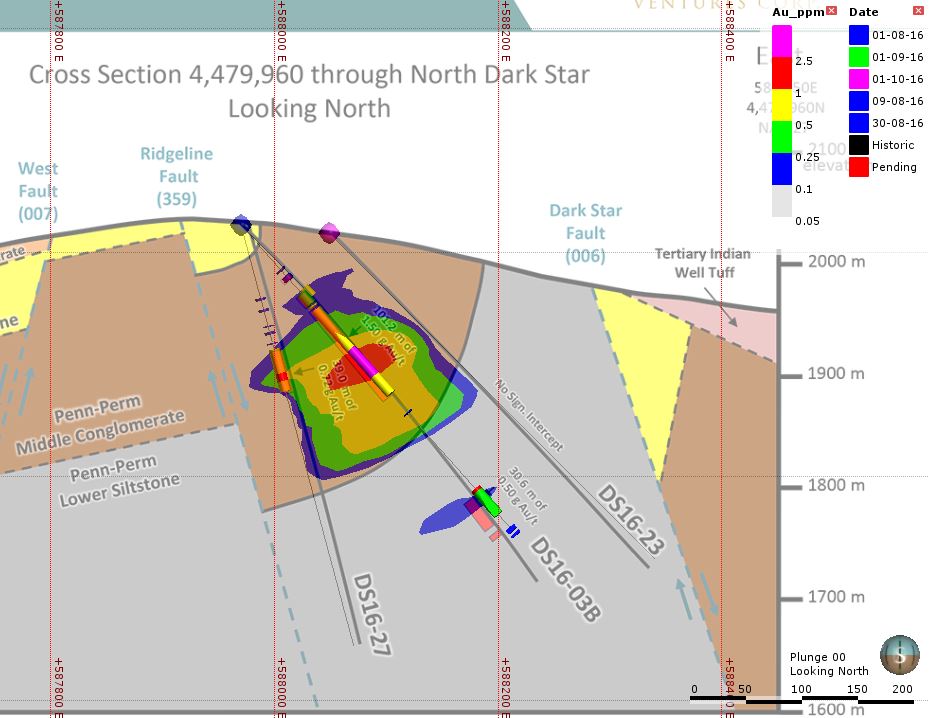
Section 4479960N

Same again....
We see the same again, some great values in hole DS16-03B, but holes 17 and 23 again drilled 60m and 70m away respectively again hit a bit of grade (hole 27) or no grade (hole 23).

All of the drilling data is telling you that there is a small, high grade core 100m wide x 500m long) at North Dark Star and grades quickly drop off.

But it isn't all bad news, hole DS16-07 hit, what may be the continuation of the Main DS deposit to the NW or maybe just a small zone of mineralization wedged between 2 faults? 

Do these narrow zones come together at depth?
Some drilling to the west of these holes would answer that, but if there is any decent mineralization out there, it is going to be deep (greater than 200m depth).

So, if I'm correct-ish, GSV now have ~3 Moz of gold at a moderate grade (0.6-0.7 g/t Au), which is nothing special, so why do they have a market cap of ~US$500m?

They don't have anything special (ok, they have a good postcode and some rich neighbors), but not a project like Juanicipio that sell themselves. There is nothing in drill data that shouts "World Class Deposit"

However, what they have done is focused on drilling out and extending the known high grade zones. You will notice that they maximize the value of their drill data by:
  1. Always including a 'stellar' intercept in all their press releases.
  2. Never have release 'bad' results on their own. You'll see that GSV always include a decent intercept with poor results 
    • e.g. Oct 20th PR - data released from 12 holes, 6 (50%) contained no gold, and only 2 (DS16-07 and 10) had semi-decent results.
  3. Release news regularly to maintain momentum and interest in the company:
    • 10 PRs since August
    • 34 PRs in 2016 - one every 10 days
  4. Raise money when you can, not when you are desperate!
    • They already had a healthy cash position but they raised >$33m to have a "significant treasury for annual strategy and beyond"
It is a good strategy, and it has allowed them to raise a lot of cash, but will the market be disappointed when they do a resource calculation on North Dark Star and tell the market that it is a bit average?

Here is an example from North Bullion - the August 30th PR data


Great assays, but at 322m depth below surface, can you do anything with it?

Just some comments regarding the DH data.
  1. Elevation data was obtained from the USGS 10m DEM downloaded from Earth Explorer
  2. Collar locations were obtained from:
    • 43-101 reports (exact)
    • digitising them from the plan maps that accompany the press releases (within 20m)
  3. Downhole survey data was taken from the assay tables, they do not include deviation.
  4. Assay data was taken from the press releases and residual grades were back calculated using Core box's excellent drill interval calculator.

Sunday, July 17, 2016

Corvus Gold - North Bullfrog

hahahahhahahahahahahahaahhahahahahahaaaaaaaaaa

(translated to Spanish: Jajajajajajajajajajajajajajajajajajajajaja - I get some readers from Peru).

Summary
Small, low grade deposit that is getting pushed as a development project.
Costs casually ignore lots of costs to make the project appear good
Comparison with actual mines just shows that the the PEA report was a simple exercise in BS

Sorry, I couldn't couldn't help myself. So, the North Bullfrog deposit. Where to begin.

Lets start with the resources - here is the table from the June 2015 technical report.
can we call these eBay resources - one mine's waste is another mine's ore?
WTF? I've been spend ages browsing the internet to find any mine (in the US) that operates at those grades. Here is what I have so far (feel free to send me other suggestions)

Mesquite Mine* (New Gold) - 0.34 g/t Au
Marigold Mine* (Silver Standard) - 0.45 g/t Au
Rochester Mine (Coeur) - 0.34 g/t AuEq (0.0933 g/t Au and 16.5 g/t Ag)
Round Mountain Mine (Kinross) - 0.79 g/t Au
Florida Canyon (Rye Patch) - 0.4 g/t Au
Phoenix (Newmont) - 0.62 g/t Au
Lone Tree Leachpad and stockpiles (Newmont) - 0.24 g/t Au (a bit unfair as this has already been mined)
Mineral Ridge Mine (Scorpio) - 1.9 g/t Au (but a small resource)


So I can't find any active mine (reprocessing leach pads and stockpiles doesn't count - sorry Lone Tree) that is mining ore with grades as low as the East Bullfrog resources (ignoring the Yellowjacket ore which will be crushed and milled so has different economics and is a small portion of the deposit).

We're all adults here, we all know that for a mine to be profitable - I'm so sorry, I'll use the nicer, more nebulous and safer terms - "generating revenue" or "cash flow positive", from now on (I don't want to scare people away by using one of the "unmentionable" words on this blog), we need to understand:


So for starters North Bullfrog has low value dirt - approx US$10.8/tonne (assuming 100% recovery and $1350/oz), but fortunately for me Corvus has done all the hard work for me in their seminal June 2015 PEA (like all popular documents a second edition (actually an Amended and restated version) was released in May 2016 (link)).

So why don't we have a close look at those numbers:
There is some obvious BS in this table
Here is the summary from the same PR:
The base case PEA assumed a conceptual WhittleTM pit shell and would be scheduled for processing as defined at a US $900 gold price.  Highlights of the PEA (in constant 2015 USD) include:
  • Pre-Tax Total Cash Flow: $479M at $1,200 gold, IRR of 53%
  • NPV(5% post-tax): $246M at $1,200 gold, IRR of 38%
  • NPV(5% post-tax): $103M at $1,000 gold, IRR of 20.5%  
  • Projected average annual production: 149 k ounces gold per year for first 6 years dropping to 68.5 k ounces gold per year for the remaining 4 years
  • Projected silver production of 2.49 M ounces Life of Mine (LOM)
  • Cash Cost per gold ounce: $635
  • Project Total  Capital Cost per gold ounce: $206
  • Initial Capex: $175M (LOM sustaining Capital $83M)
  • Strip ratio of 0.6-1 (waste to ore)
  • Gold recoveries of 87% mill and 74% heap leach
  • Mill resource grade increase of +100% to 2.1g/t gold
  • YellowJacket/mill resource confidence increased significantly with 91% in Measured & Indicated category up from <20% in 2014 resource
In summary:

But we all know that cash costs are BS, so why don't we go down the rabbit hole.

Look closely at table 22-3 (which is an expanded version of table 4)


What other costs are passed over in the press release?
  • CAPEX and LOM Capital - we can ignore this costs of $1.5/tonne for the press release
  • Moving the waste - $1.52/tonne (from the technical report - page 232)
  • Royalties - at least they tell us they are ignoring these costs
So if we add the costs to move the waste rock, the cost per tonne increases from:
  • $4.62/tonne - the press release figure
  • $6.12/tonne - the technical report figure
  • $7.64/tonne - technical report figure + costs associated with moving the waste rock.
So the 'all inclusive' cost/tonne is only $3.02 more that the PR figure (65% more - so nothing substantial), and that increases the cost/ounce from $635/oz to $963/ounce.

That is a bit different, we've only added an additional $330 onto the costs/ounce and that was the obvious stuff.

When I look at table 22-4 - the annual production and cash flow chart for North Bullfrog I get confused (easily done as I'm a geologist).


Why is the Capex in year -1 $162.1M not $175.4?
They also moved 6.8 million tonnes of waste for free (operating cost cell is blank).
When I check the operating costs values they average $4.38/tonne so again there appears to be no costs associated with moving the waste rock, so I decided to update this table with:
  • Overburden mining costs = $1.52/tonne
  • Operating costs = $4.62/tonne


Our operating costs have increased by $183M and Pre-tax cash flow has decreased by nearly $200M (or by 41%). I need to recalculate the Federal income tax (I've left these values the same). So there has been a significant change in the economics of the project.

How do these number compare with other operations.

Round Mountain - 2015 costs
  • cash costs = $750/oz
  • Op earning = -$8.9M
  • grade 0.94 g/t Au
  • Real operating costs = $1210/oz

Mesquite Mine
  • cash costs = $743/oz
  • Op earning = $54.88.9M
  • grade 0.34 g/t Au
  • Real operating costs = $1156/oz
So these mines are bigger and higher grade, and have a long history of producing significant number of ounces and according to the 2015 financial reports at $1200/oz they are moderately profitable. Corvus say that they can build and operate a mine with lower grades (averaging 0.21 g/t Au) and be more profitable that several long lived mines.

The other issue you have with very low grade operations is that they are very unforgiving, a minor change in CAPEX (there are hundreds of projects that have done over budget), schedule, recovery (a few percent change in recovery would be disastrous), dilution and average grade could lead to massive issues.

There are better projects out there that are bigger and higher grade that are waiting to be developed, I can't see North Bullfrog competing with these. I'll spend some time working with the exploration data to see if there is any potential to define/expand more high grade resources, but it is simple too low grade to be viable unless gold prices increase significantly.


Saturday, July 16, 2016

Columbus Gold - Eastside Deposit

I mentioned (many moons ago) that I was working on a review of the Eastside deposit that is currently being explored by Columbus Gold.

Summary

  • The deposit has a good 'zip code' located near to several major mines/deposits.
  • Initial drilling has identified a two zones (east and West zone) of low to moderate grade gold mineralisation with sub-vertical higher (>1 g/t Au) grade zones.
    • These zones appear to be approx. 25-75m wide.
  • The East zone mineralization appears to be open to the south (drill-hole ES-100) and to depth.
  • Better mineralisation is relatively deep (<200m) - can this be mined from an open pit?
  • Many of the thick 'ore' grade intercepts are actually wide low grade zones with higher grade intervals.
    • e.g. ES-080 - 500' (~150m) @ 0.71 (economic) has a residual grade of ~0.37 g/t (marginal) when you remove the high grade intervals
    • ES-100 - 329' @ 0.63 g/t Au - the residual grade is ~0.4 g/t A

Issues

  • Vertical drill holes maybe drilling down vertical gold zones, this can lead to over-estimation of thicknesses and grades of these zones (but they do make for sexy PR headlines).
  • Metallurgical test work has been conducted on samples that are much higher grade that the estimated average grade of the mineralisation.

I think there are better project in invest in, I quite like Gold Standard's Railroad project (I'm working on reviewing this project now), but this could be one to keep an eye on, especially if they get some better results from drilling around hole ES-100.


I found this project very interesting to work with, the drilling has found two zones of gold mineralisation (East and West). Near surface the gold is relatively chaotically distributed (in narrow veins/structures) and at depth these high-grade zones appear to widen and are surrounded by a wide zone of low grade disseminated mineralisation.

We see our normal exploration company trick of grade expansion - increasing the average grade of wide zones by including narrow high grade intervals. This happens with frequency at Eastside, but Columbus have included a number of sections (link) that you can see what is going on.


Section 8900N
Zoomed in:
That 265' section really grades 0.31 g/t Au

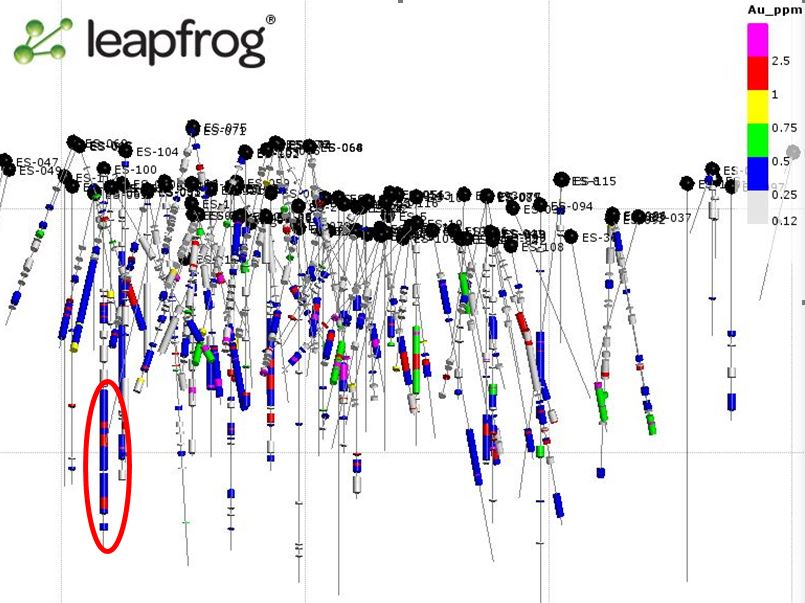
So, here is the project in 3D (Columbus have a video here (link) - the interesting part is from 2:30 onward)


You can quickly see that the majority of the intercepts are less than 0.5 g/t Au (yellow) with relatively few high grade hits.


When you strip out the impact of the narrow high grade zones, the thick high(ish) grade zones disappear, We've gone from a nice, thick economic intercepts (for open pit mining) to low grade ore with thin, narrow high grade zones

Again you can download my 3D model here (link)

Just eye-balling the data, the majority of the mineralisation at Eastside sits between 0.25-0.5 g/t Au (for reference - Silver Standard are mining 0.45 g/t Au rock at Marigold), and when you couple that with the fact that the 'good' mineralisation appears to start at around 100m depths, it begs the questions, are the grades good enough to sustain a large pre-strip to get to some low grade material?

But it isn't all bad news. Drill-hole ES-100 intersected a thick zone of moderate grade rock (section 28740 - below).

Section 28740N
This zone has been poorly drilled, many of the drill-holes around this area were stopped before they could reach this zone, and one hole (ES-112 - results pending) was drilled to see if this zone continues to the south, but may be poorly located and could actually miss the target.
Maybe Columbus could see about extending drill-hole ES-103 by another 300m

I've going to keep my eye on Eastside, at the moment the drilling to date hasn't defined any decent grade mineralisation, but hole ES-100 offers some hope. If hole ES-112 is successful, this could be a project to key your eye on.


However, I did see some issues.

When you watch the video and spin around the data from Eastside (you can download my model from here (link) and open it up the the Leapfrog viewer), you 'll notice that the 'best' intercepts (the thickest, highest grade zones) appear to come from vertical drill-holes.


A series of structurally controlled gold zones with low grade halo?


This is typically where you have vertical mineralisation, a few holes get lucky and drill down a high grade zone and give great results, but often holes miss them and give you low grade (or nothing). I would like this zone to be drilled with some angle holes so to provide more info on the nature of the mineralization. Good rule of thumb - if a project has only been drilled by vertical holes, there will be issues.


I also noticed in the March 2015 technical report was the inclusion of metallurgical test results. This was surprising for a project with no resources, but it is good to have as you need to know if you can actually recovery the gold and silver. If the recovery is crap, it gives you an opportunity to walk away and spend money elsewhere.

It was stated that the recoveries were good, 94.8% for Au and 52.1% for Ag. That is excellent recovery for gold, and for silver, it is such a minor constituent, no-one really cares about it. If you look at the accompanying table (12.1 - page 48), you'll notice something.

Cast a quick look at the drill-intercepts figure above, you can see that the majority of the drilling intercepted grades between 0.25 g/t Au and 0.5 g/t Au. How many of the samples in the table above lie in this range?
The answer is 1 - sample 70908 - averaged 0.342 g/t Au. Every other sample (13 or 93%), can from material that was, in cases, significantly higher grade. This essentially means that the metallurgical results are useless. I would like to see the results from sample 70908 to see it its recovery is significantly different from the other samples as it is testing modal (the most frequently occurring) i.e. the majority of the mineralized material in the deposit. If the recovery for this grade material is poor, the deposit has no value.

Why is this important? I've taken some data from Gold Standard Resources Pinion project (link) to illustrate.


I chucked the numbers into Excel so we can see them visually.

As cut-off grades increase, number of indicated resources decrease.

This is logical, basically you have smaller amounts of higher grade material, and this means that a similar pattern is seen in the contained ounces.

Less tonnes (albeit at higher grade) = less ounces. At a 0.6% cut-off we reduce the ounces of gold by 38% and only 76,000 ounces (12% of the indicated resources) are found in blocks grading >1 g/t Au.

If we assume that a similar pattern is seen at Eastside, and just working with the subset of data that I got from their website, we can see that:
  • 51% of the assays are less than 0.25 g/t Au
  • 79% are less than 0.5 g/t Au
  • 86% are less than 1 g/t Au
  • only 6% grade > 2 g/t Au
If we ignore the samples grading less than 0.25 g/t Au (I'm assuming that this will be waste), we now see that:
  • 44% of the samples assay 0.25-0.5 g/t Au - 1 met sample (7%)
  • 29% grade between 0.5 and 1 g/t Au - 2 met samples (14%)
  • 14% grade between 1 and 2 g/t Au - 5 samples (36%)
  • 13% grade over 2 g/t Au - 6 samples (43%).
NOTE: my data is biased due to the over reporting of high grade intervals in the press releases.

So we can quickly see that there is an extreme bias in the metallurgical sampling. The majority (79%) of the samples test were from high grade areas which (using the Pinion charts as a guide) will probably form a minor (less than 15%) part of the deposit. If this company is serious about mining this deposit (at this stage they aren't), I would like to see a few more samples testing the average grade material.

I was a bit disappointed with the quality of data released to the public by Columbus. I identified numerous errors:
  • Incorrect distances (lots of typos and some unit conversion errors)
  • Average grade errors - several intervals gave me negative residual grades.
  • Incorrect drill-hole data in an earlier technical report table (reported earlier).
This may suggest a lack of attention to detail (i.e. rushing data into press releases), and they are probably just minor issues (my belief). However, it makes you think a bit more a dig deeper to see if this is actually a reflection on the attitude of the company when handling exploration data. I don;t think this is happening here, but is more common that you think, especially in Latin countries emphasis is put on data presentation (i.e. how "pretty" the logs are) rather than the importance of collecting high quality data.


Saturday, June 11, 2016

Does Columbus know how to use a compass?

I'm working on compiling some data from the Eastside deposit, but I noticed this little howler. So I thought I would share it.

just a small part of the April 29th PR Map

and from the March, 2015 43-101 report:

Just a list of random number
Do you see it?

Here is a little clue.
On the map, the circles are where the drill-holes are located, next to each one is the following info:
  • Hole Name: e.g. ES-22
  • Angle of Dip: e.g. -45 (-90 = a hole drilled vertically down)
  • Azimuth: e.g. E (for east or 090), or because they are Sepos* they use Quadrant Bearings (e.g. S79E which for normal people is 101 - the bearing is 79 degrees from south in an easterly direction)
  • hole depth in feet e.g. 505' ("'" = ft - just ask Spinal Tap (link))
 Look closely at drill holes ES-14, 20, 21 22, and 31. Do you see it?
  • Drill-holes ES-14, ES-21 and ES-22
    • on the map they have been drilled eastwards (090)
    • in the technical report they are listed as being drilled westwards (270)
  •  Drill-holes ES-20, and 31, we have the reverse
    • onm they way the holes have been drilled to the west
    • in the table they are listed as being drilled to the east.
I', hoping that it is a little issue with the map, so, Colombus (thanks Adidas), give your drafts-person (we're PC here) a slap.

If it isn't a simple drafting errors and you've used the wrong values in the technical report, that would be interesting...

 *ask your Aussie friend what it means