Monday, August 15, 2016

How to break bad news...

What happens if you are a mining company (I use this term loosely) and you loose your only producing mine, do you:
  1. Inform your shareholders and the exchange where you are listed that you are having issues and request a trading halt
  2. Don't say anything
If you went for (2) then you will love this gem from Aurcana informing the world that they lost their only producing mine, La Negra to Orion Mine Finance.

How did they show this

The PR from the January 5th, 2015 (link) had this at the end:

About Aurcana Corporation
Aurcana Corporation is a primary silver producing company with two properties: the La Negra Mine in Mexico and the Shafter Silver Project in Texas, US. The latter was put on care and maintenance in December 2013, in part due to depressed silver prices.


and from the PR dated 7th Jan - yes, 48 hours later (link), the about section was:
About Aurcana Corporation
Aurcana Corporation owns the Shafter Silver Project in Texas, US. The Shafter Silver Project was put on care and maintenance in December 2013, in part due to depressed silver prices.


They were so transparent about announcing the bad news I had to call them up to confirm that they were no longer operating (or owning) the La Negra mine.

Can we call that burying some bad news.

I'm learning some really good tricks here.....

You may be wondering why I'm putting out this post - and it is basically a quick ask for help, but I'm building up a database (that will be in future post) of the lowest grade mines in the world to basically give you a guide to quickly see how the resources for your favorite project compare against operating mines.

I'm not sure if I should include La Negra as the mine is closed.

This is what I have so far:

Gold Silver - Open Pit
  • Rochester Mine, NV - Coeur Mines - 0.093 g/t Au, 16.5 g/t Ag

Copper - Open Pit
  • Aitik, Sweden, Boliden Mines - 0.15 g/t Au, 1.3 g/t AG, 0.23 % Cu
  • Sierrita, AZ, USA - Freeport - 0.24% Cu,1.4 g/ Ag, 0.03% Mo

Base Metal
  • La Negra, Mexico, Aurcana - 55 g/t Ag, 0.24% Pb, 0.98% Zn - closed, lost to Orion Mine Finance
  • San Jose, Mexico, Arian Silver - 119 g/t Ag, 0.38% Pb, 0.85% Zn - closed, lost to Quintana Resources
If you can help and send me info on crap mines (that are currently operating) that would be greatly appreciated.

I know that mining depends not just on grade, but also costs and recovery rates. For the post I just want to keep it simple.


Why does drill direction and dip matter?

A big thanks to Darryl Lindsay for prompting me to expand on a point I made in the Cascabel post summary but didn't explain it any further, and to Exupery for asking for some clarification.

Imagine you are a long suffering director of a junior exploration company. Those damn geologists want to spend money drilling a gold project whereas you just want to stake some Lithium prospects in Nevada/Chile/Argentina etc, and live the good life in Vancouver/Toronto/London etc.

Junior companies don't have massive piles of cash and drilling is expensive (this varies by country - but diamond drilling will be around $200-300/m), but you relent and allow them to drill a few holes (1500-3000m) costing around ~$0.5 to 1 million (or more).

You an see the costs add up quickly, so it is key not to waste money (remember every dollar put into the ground is a dollar less for your expenses) by drilling holes with low potential to get a good intercept that you can use to generate news and interest and provide an opportunity to raise money.

Some company's go to the 100% total BS end of the scale to maximize either the thickness or grade from a drill-hole, and the prize for this goes to Avrupa Minerals for their Slivovo project in Kosovo.

I have to admit, I didn't think drilling companies allowed you to drill holes at such a shallow angle.

Even the well known exploration companies can get on the bandwagon - here is some drilling from their Kipushi project in the DR of Congo, but as this is at 1000m depth, there are few areas where holes can be drilled from.

Hole 3 - bit of a promo hole, but still a great deposit.


In other cases it is accidental, the company doesn't know what the controls are on mineralisation and a few of the early holes have been drilled down the middle of a vein/high grade zone of high grade, or it has been assumed that the mineralisation is 'disseminated' and can be explored with vertical holes - this is a very common, but bad practice.

What should you look out for?
  • The company is drilling vertical (-90 degrees) or nearly vertical (>-85 degrees) holes
    • This is OK if the mineralisation is horizontal (e.g. sediment hosted copper, mantos etc..) - again you can check this by looking at any sections the company has included in the press release or on their website.
    • If you are drilling very deep deposits, a vertical holes is the quickest (and therefore cheapest) way to get there.
  • Large changes in grade between drill-holes that are very close to one another
    • In gold deposits this is harder to see due to the nugget effect.
Here is an example from a Cu-Au project in Peru.

This can cause major issues for mining

Let us zoom in a bit where we have 1 hole that hasn't been drilled vertically.

So we go from gold to no gold over 45m....


What is happening? Basically you have a strong vertical control on mineralisation, i.e. the gold is found in narrow, near vertical zones and when a hole hits the middle of that zone you gets lots of gold, and when it misses, you get no gold.


I've put on some hypothetical drill-holes (black lines) that target the good gold zones, and we know that no exploration company would ever try and abuse the situation to maximize their results....

A more extreme example

All that glitters is gold
This is from a gold project in Canada - but you can see that the Au vein is only a very small portion of the rock, and if the holes had been drilled at a different angle you would have drilled much less vein and much more barren rock.


We also see this to some degree at Cascabel. It is a porphyry deposit the copper and gold are not evenly distributed but is found in veinlets and fractures.

This is typical porphyry mineralisation


What does this mean when we look at the drill results?

I've included a couple of sections to illustrate:


Drill-hole 15-012 - is a near vertical hole (drilled at -87 - so 3 degrees off vertical), it intersected:
  • 58m @ 0.15 g/t Au and 0.47% Cu from 186m
  • 38m @ 0.171% Cu
  • 52m @ 0.127 g/t Au and 0.41% Cu.
Drill-hole 13-004 intersected 158.3m @ 0.05 g/t Au, 0.11% Cu - or using a technical term "Crap".


lets look a bit closer
These holes are 2.5m apart where they cross, yet the grade is very different.


This hole came within 2.5m (a car length) of hole 012 (they cross over in the low grade zone). They essentially drilled the same piece of rock, but one holes (the vertical one) hit lots (relatively speaking) of gold and copper and the inclined hole hit nothing.

How can 1 hole (012) hits lots of copper and gold and another hole (13-004), exploring virtually the same area hit nothing? If the mineralisation was disseminated we would expect to see both holes returning grades that are very similar.

This means there is a strong vertical control on the veins (therefore the grade) at Cascabel, which is normal for a porphyry deposit. Here is the section where I have (crudely) drawn some >1% Cu zones.

Steep holes = great intercepts, angle holes = low grade intercepts. Just imaging the grade of a holes drilled down the guts of a high grade zone - 800m @ >2% CuEq? What would that do to their share price?
I'm not accusing Sol Gold of misleading people, I'm just using their data illustrate a point. As the mineralization at Alpala is deep, they simply can't afford to drill 1.5-2km deep holes to cut the mineralisation at a shallower angle. I just want people to think about what they are seeing and to spend a bit of time looking at data.

Download the Leapfrog viewer file here (link) - it is the same as the one in the previous post on Cascabel, and spin around the data ans use the ruler tool to measure the distance between drill-holes.


Gold Standard Ventures - Amazing Dark Star?

Wow, Gold Standard Ventures have just announced some spectacular results from their North Dark Star project in Nevada. They have been announcing some excellent results for several months, and I promised that I would look at their data and see if it is the real deal or not.

Summary and Questions
  • High grade near surface (70m depth) mineralisation drilled to the north of a small (<0.4Moz), low-moderate grade (0.5 g/t Au) deposit.
  • Potential to increase resources by 0.5-1Moz - there isn't room between 2 deposits for a massive deposit.
  • Mineralization is open to depth and along strike (minor drilling to North).
  • Results from drill-holes 16-03B and 23 will be key to see the extents of the >1g/t zone.
    • Have the results been received from these holes
  • There is a 5% underlying NSR on Dark star, which is
    • This is high - 2.5% would be more normal, and could it restrict future development?
    • Investment from Goldcorp and OceanaGold probably means no.

Dark Star isn't a new project, it was discovered in 1984 and over a 100 holes (or ~59,000 meters) have been drilled, and GSV released a small resource in 2015.

meh - small and low grade
Nothing special here, most people would have ignore it as too small and too low grade, but it has a great post code. It is smack in the middle of the Carlin Trend and right next door to a major deposit.

Middle of a big gold trend, with some decent deposits (Emigrant and Rain) immediately to the north.

So you have a great story, big land holding, next to a major mine and some old, small deposits but with some good, thick >1 g/t Au historic intercepts - an intriguing story.

lots of holes, yellow - low Au intercepts, red = good Au intercepts.

You can see that most of the historic drilling has focused on the Dark Star deposit with a few scattered around returning generally low gold values. The exception is a single hole at North Dark Star. This is fairly common, exploration companies are very conservative and explore the low risk targets (i.e. where gold has already been drilled).


This is systematic exploration - no-one wants to drill 200+m of nothing, so they reduce the risk by drilling 50m or 100m beyond the known gold zones to see if they hit some more, and GSV have done the same and focused on expanding the known gold zones and drilling the gap between Dark Star and North Dark Star which has yielded some great results.

Let's look at those in detail. I've only been able to find the data for the 2015 and 2016 drill programs, as the only data from the historic drilling is a summary assay table in the 43-101 reports. There was no maps showing where the old holes were drilled, so I wasn't able to show them in 3D.

this is all you get - red = outline of Dark Star deposit.

If we look at the latest PR, GSV released some excellent results from holes DS16-02, 05 and 08, but where are the results from holes 01, 02, 04, 06, and 07 as drilling is normally done in sequence.
We can tell from the presentation - slide 12 - that they have 2 rigs drilling at Dark Star and they are drilling holes DH16-21 and 23, so potentially we are missing the assays for 18 completed drill-holes. Possible scenarios:
  • Were the holes drilled out of order?
    • Holes 02, 05 and 08 were the highest priority holes and were drilled first, and therefore they are the first holes sampled and therefore the first holes from which data has been released.
  • The samples for all the holes have been sent to the lab and we are waiting for the results?
    • Were the samples from holes 02, 05 and 08 rushed (i.e. a premium is paid so that the assay lab processes these samples ASAP)?
    • This would mean that these 3 holes contained the 'best' mineralisation/strongest alteration, suggesting the other holes may not be as well mineralized?
  •  GSV have the results from these holes, but the grades were poor and they decided not to release the results?
    • This is fairly common with holes that didn't return significant values only reported in the 'end of program' summary press release.
I'm going for the 1st scenario, GSV drilled the first holes in the 'best' area of the deposit, and wanted to better understand the high grade zones hit by hole DS15-13 (97, at 1.6 g/t Au). I just posed this question to make you think not just about the data that was released, but to think about what data was not released.

Here is where the gold is found in the main deposit from the historic drilling.

Section from 43-101 report through the Dark Start deposit

It is in the conglomerates, so when we look at the recent results, we see a similar pattern, just more gold.

North Dark Star section

However, there is one big difference, in the main deposit the mineralisation is found along the contact of the conglomerates and overlying siltstones, whereas in the north we can see that the gold is in the same place, but there is a lot more faulting. In many Carlin-type deposits these faults are often the conduits for Au fluids, and it is likely that the recent drill-holes are good is because they were drilled close to these source structures.

Are the faults before or after gold was emplaced?

I'm really interested in the results from hole 16-01. Will it show us that the high grade zone continuing to depth or show that the left hand fault (or west fault) also was a source for gold mineralisation and potentially expand this high grade zone to the west where favorable rocks (the brown units) are close to surface?


I and can't wait to see the results from holes 16-03B and 23 - they have been drilled about 120m south of hole 16-08, and it will be great to see if this high grade zone continues.Again, please refer to the questions above - these assays may have been received by GSV, but not 'good enough' to be released.

Long Section (looking W) - North Dark Star drilling and grade interpolants.

I'm predicting that it will and that hole 3B should hit ~100m grading >1 g/t Au starting from 100-120m depth, and hole 23 some similar mineralisation and shallower grades, if the gold distribution is relatively uniform.


I also expect holes 16-07 and 19 to hit the continuation of the gold zones hit in hole DS15-06, but my estimate is that they will be at ~250m depth, and approx. 0.5-1 g/t - a bit deep and low grade.

Grades appear to be getting better with depth, but 0.5-1g/t Au @ 200m depth is too little, too deep.

In summary, some very good, near surface gold assays, but the results from holes 16-01, 3B and 23 will be key to see if the mineralisation is:
  • Small, 10-15 million tonnes zone at ~ 0.75 g/t Au = ~0.4 Moz contained gold
  • Medium with upside - >40 million tonnes at 0.75 g/t Au for  >1Moz Au.
I went through the technical reports to see if there was anything negative.

Metallurgical test work was conducted in 1991 and gave an average recovery of 82% (ranging from 75% to 91%) from 8 composite samples assaying 0.38 g/t to 1.5 g/t Au - this covers low, medium and high grade mineralisation. Nothing to worry about here. You can see the summary data in Section 13 in the April 2015 technical report.

However, when I was checking the ownership information as Nevada is a checkerboard of private (patented), and public (state and federal) ownership, I found this - figure 4.2 in the April 2015 technical report.

Dark Star deposit outline in red, GSV 2015/16 drilling = black circles.

For the Dark Star deposit there is an underlying 5% Net Smelter Return (NSR), and where the recent high grade hits have come from has a 3-4% NSR. This is high, compare them to the NSRs that Franco Nevada have on exploration projects (link) in the US, and most are between 1.5-3%. Could this be a burden that would prevent the project from being developed?
There are similar royalties at the other deposits and it hasn't prevented Goldcorp and OceanaGold from investing.

I like this project, the team at GSV have manged to consolidate a large land position in one of the world's premier gold districts and are getting some great results (hence their recent share price surge). At Dark Star there is good potential to expand the recent high grade zones and if they do, they have a great opportunity to significantly increase resources find more

Again, all of this is available in a leapfrog viewer file (link), so you can spin the data around and form your own opinion.


Saturday, August 13, 2016

Why I do it...

I've been asked on a few occasions why I'm doing this blog. For me I enjoy looking at the data from various exploration projects from around the world and trying to separate the chaff from the wheat.

I've also heard through a variety of sources that some geologists are reading this blog, which is nice, if you are interested in having a copy of the full Leapfrog Geo projects, you can contact me at:


and I'll upload my project file to this and any other project mentioned to my google drive so you can download it.

The reason I've been uploading just viewer files is that you can download the viewer for free and a  Leapfrog Geo license costs $12.5K, which may be a bit expensive for the average person.

Friday, August 5, 2016

SolGold - Cascabel Project - A snake in the Grass?

SolGold (AIM: SOLG.L - www.solgold.com.au) have been announcing some very impressive drilling results from their Cascabel project in Ecuador. They have been reporting some of the best porphyry copper-gold intersections in the world, Ever!

Summary.
  • Very good Au-Cu intercepts, but mineralisation is deep (>500m).
  • Bad location
    • Ecuador, need I say more....
    • Local access issues?
Here are some questions that I was thinking when playing around with the data:
  • Why no backing from a major company? With the reported grades you could expect a more adventurous major taking an interest to playing the long game?
  • Why is no future drilling planned for any of the other targets?
  • Are the great intercepts skewed by the fact that the holes are nearly vertical and been drilled into a vertical deposit?
  • If the Aguinaga targets is key (heck they even have an open pit outline on their geofizz anomaly), why no drilling planned on it this year?


I was intrigued, a small ASX and AIM listed company with a $0.1 share price (or 6p in old world money) and a $80-90M market cap (ahh a normal ASX listed company where a tight float is if you have less than a billion shares issued).

So I went through the project data all the way back to 2013 and  brought as much data as I could find so I could review it and to separate the reality from IR spin. This was hard to do. There was a lot of fluff in the press releases, but some nice photos which were very informative.

This is understandable as they have been drilling some very deep drill-holes (up to 2000m) and these holes take a lot of time to drill (2-3 months per hole), and the company, understandably, wants a continued stream of news from their , but it made it a challenge to find out true hole depths, azimuths and so on....

But I have my ways (and a bit of basic trigonometry helped), and here is what I could extract and share with you, and I've also included their proposed drill-holes (azimuths and depths are educated guesses).

At first glance hey aren't too bad, I thought I had found a decent project with good upside.

left = PR results; right = split assays

All of the drilling to data (18 holes for 23,700m drilled) into the Alpala target and they have defined a 500m x 500m x 1500m (vertical extent) zone of porphyry Cu-Au mineralisation. But, darn, the high grade stuff is really deep, starting at around 500+m depth.

When I looked at the data I noticed that most of the drill-holes were almost vertical and you combine this with what looks like a vertical deposit you get to understand why the grades they have been reporting are so good.

They have hit some low-moderate grade (0.25 g/t Au and 0.25% Cu) mineralization near surface, but it is thin (250m x 125m), and what do they photos show us?

No oxides

As you can see those rocks aren't beautiful shades of green, and Sol Gold nicely tell you multiple times that they have bornite and chalcopyrite at surface. So no nice and cheap to mine and leach oxide ore. We can ignore this, it is too small, too low grade.

The value in this deposit is the high(ish)-grade mineralisation at depth, and Sol Gold nicely show us their conceptual 6km ramp that will run below their Aguinaga target to below Alpala, which is nice.


Often you can tell a lot about a project by what isn't being told. All of the drilling is focused into a small 650m x 550m area.

Red blobs = good! Yellow blobs = drilled holes.

When we look at their proposed phase 2 drilling, again, all of them are focusing to drill into the area of known mineralisation, no holes appear to be planned for any of the other targets. Why is this?

Nice and adventurous!


You would think that they would plan a couple of drill-holes for some of their other targets that have similar (or better) exploration results? All we see in the PRs are a few surface samples and a single trench.

When you look at the planned holes, they aren't being drilled from the optimal locations, and we have multiple holes being drilled from the same platform, often where holes historic holes have been drilled (some platform recycling - cuts down on prep time and reduced the footprint of the drilling).

So for the phase 2 program only a single new platform is being built? No holes are planned for other targets? There could be a number of reasons:
  • Sol Gold only has access to a small part of the property. This could be very bad news as it could mean that there is local resistance to the project. 
    • This could be minor - the company hasn't started dialogue with communities adjacent to Alpala.
    • Major - the local communities are anti-mining. if that is the case. the project is dead.
  • They don't have permits to drill/explore other areas - basically they are continuing to work within the limits of the current environmental permit that may have a limit on the number of pads (but not drill-holes) that can be built.
    • Minor - this basically takes time (and money).
So there you go, an interesting project, with some good rocks, but in the wrong location. Maybe once Mirador is built (or Sol Gold decide to issue $17B of loans to Ecuador to get special treatment), this could be a good project.

Leapfrog viewer link here

One to keep on your radar.


Sunday, July 17, 2016

Corvus Gold - North Bullfrog

hahahahhahahahahahahahaahhahahahahahaaaaaaaaaa

(translated to Spanish: Jajajajajajajajajajajajajajajajajajajajaja - I get some readers from Peru).

Summary
Small, low grade deposit that is getting pushed as a development project.
Costs casually ignore lots of costs to make the project appear good
Comparison with actual mines just shows that the the PEA report was a simple exercise in BS

Sorry, I couldn't couldn't help myself. So, the North Bullfrog deposit. Where to begin.

Lets start with the resources - here is the table from the June 2015 technical report.
can we call these eBay resources - one mine's waste is another mine's ore?
WTF? I've been spend ages browsing the internet to find any mine (in the US) that operates at those grades. Here is what I have so far (feel free to send me other suggestions)

Mesquite Mine* (New Gold) - 0.34 g/t Au
Marigold Mine* (Silver Standard) - 0.45 g/t Au
Rochester Mine (Coeur) - 0.34 g/t AuEq (0.0933 g/t Au and 16.5 g/t Ag)
Round Mountain Mine (Kinross) - 0.79 g/t Au
Florida Canyon (Rye Patch) - 0.4 g/t Au
Phoenix (Newmont) - 0.62 g/t Au
Lone Tree Leachpad and stockpiles (Newmont) - 0.24 g/t Au (a bit unfair as this has already been mined)
Mineral Ridge Mine (Scorpio) - 1.9 g/t Au (but a small resource)


So I can't find any active mine (reprocessing leach pads and stockpiles doesn't count - sorry Lone Tree) that is mining ore with grades as low as the East Bullfrog resources (ignoring the Yellowjacket ore which will be crushed and milled so has different economics and is a small portion of the deposit).

We're all adults here, we all know that for a mine to be profitable - I'm so sorry, I'll use the nicer, more nebulous and safer terms - "generating revenue" or "cash flow positive", from now on (I don't want to scare people away by using one of the "unmentionable" words on this blog), we need to understand:


So for starters North Bullfrog has low value dirt - approx US$10.8/tonne (assuming 100% recovery and $1350/oz), but fortunately for me Corvus has done all the hard work for me in their seminal June 2015 PEA (like all popular documents a second edition (actually an Amended and restated version) was released in May 2016 (link)).

So why don't we have a close look at those numbers:
There is some obvious BS in this table
Here is the summary from the same PR:
The base case PEA assumed a conceptual WhittleTM pit shell and would be scheduled for processing as defined at a US $900 gold price.  Highlights of the PEA (in constant 2015 USD) include:
  • Pre-Tax Total Cash Flow: $479M at $1,200 gold, IRR of 53%
  • NPV(5% post-tax): $246M at $1,200 gold, IRR of 38%
  • NPV(5% post-tax): $103M at $1,000 gold, IRR of 20.5%  
  • Projected average annual production: 149 k ounces gold per year for first 6 years dropping to 68.5 k ounces gold per year for the remaining 4 years
  • Projected silver production of 2.49 M ounces Life of Mine (LOM)
  • Cash Cost per gold ounce: $635
  • Project Total  Capital Cost per gold ounce: $206
  • Initial Capex: $175M (LOM sustaining Capital $83M)
  • Strip ratio of 0.6-1 (waste to ore)
  • Gold recoveries of 87% mill and 74% heap leach
  • Mill resource grade increase of +100% to 2.1g/t gold
  • YellowJacket/mill resource confidence increased significantly with 91% in Measured & Indicated category up from <20% in 2014 resource
In summary:

But we all know that cash costs are BS, so why don't we go down the rabbit hole.

Look closely at table 22-3 (which is an expanded version of table 4)


What other costs are passed over in the press release?
  • CAPEX and LOM Capital - we can ignore this costs of $1.5/tonne for the press release
  • Moving the waste - $1.52/tonne (from the technical report - page 232)
  • Royalties - at least they tell us they are ignoring these costs
So if we add the costs to move the waste rock, the cost per tonne increases from:
  • $4.62/tonne - the press release figure
  • $6.12/tonne - the technical report figure
  • $7.64/tonne - technical report figure + costs associated with moving the waste rock.
So the 'all inclusive' cost/tonne is only $3.02 more that the PR figure (65% more - so nothing substantial), and that increases the cost/ounce from $635/oz to $963/ounce.

That is a bit different, we've only added an additional $330 onto the costs/ounce and that was the obvious stuff.

When I look at table 22-4 - the annual production and cash flow chart for North Bullfrog I get confused (easily done as I'm a geologist).


Why is the Capex in year -1 $162.1M not $175.4?
They also moved 6.8 million tonnes of waste for free (operating cost cell is blank).
When I check the operating costs values they average $4.38/tonne so again there appears to be no costs associated with moving the waste rock, so I decided to update this table with:
  • Overburden mining costs = $1.52/tonne
  • Operating costs = $4.62/tonne


Our operating costs have increased by $183M and Pre-tax cash flow has decreased by nearly $200M (or by 41%). I need to recalculate the Federal income tax (I've left these values the same). So there has been a significant change in the economics of the project.

How do these number compare with other operations.

Round Mountain - 2015 costs
  • cash costs = $750/oz
  • Op earning = -$8.9M
  • grade 0.94 g/t Au
  • Real operating costs = $1210/oz

Mesquite Mine
  • cash costs = $743/oz
  • Op earning = $54.88.9M
  • grade 0.34 g/t Au
  • Real operating costs = $1156/oz
So these mines are bigger and higher grade, and have a long history of producing significant number of ounces and according to the 2015 financial reports at $1200/oz they are moderately profitable. Corvus say that they can build and operate a mine with lower grades (averaging 0.21 g/t Au) and be more profitable that several long lived mines.

The other issue you have with very low grade operations is that they are very unforgiving, a minor change in CAPEX (there are hundreds of projects that have done over budget), schedule, recovery (a few percent change in recovery would be disastrous), dilution and average grade could lead to massive issues.

There are better projects out there that are bigger and higher grade that are waiting to be developed, I can't see North Bullfrog competing with these. I'll spend some time working with the exploration data to see if there is any potential to define/expand more high grade resources, but it is simple too low grade to be viable unless gold prices increase significantly.


Saturday, July 16, 2016

Columbus Gold - Eastside Deposit

I mentioned (many moons ago) that I was working on a review of the Eastside deposit that is currently being explored by Columbus Gold.

Summary

  • The deposit has a good 'zip code' located near to several major mines/deposits.
  • Initial drilling has identified a two zones (east and West zone) of low to moderate grade gold mineralisation with sub-vertical higher (>1 g/t Au) grade zones.
    • These zones appear to be approx. 25-75m wide.
  • The East zone mineralization appears to be open to the south (drill-hole ES-100) and to depth.
  • Better mineralisation is relatively deep (<200m) - can this be mined from an open pit?
  • Many of the thick 'ore' grade intercepts are actually wide low grade zones with higher grade intervals.
    • e.g. ES-080 - 500' (~150m) @ 0.71 (economic) has a residual grade of ~0.37 g/t (marginal) when you remove the high grade intervals
    • ES-100 - 329' @ 0.63 g/t Au - the residual grade is ~0.4 g/t A

Issues

  • Vertical drill holes maybe drilling down vertical gold zones, this can lead to over-estimation of thicknesses and grades of these zones (but they do make for sexy PR headlines).
  • Metallurgical test work has been conducted on samples that are much higher grade that the estimated average grade of the mineralisation.

I think there are better project in invest in, I quite like Gold Standard's Railroad project (I'm working on reviewing this project now), but this could be one to keep an eye on, especially if they get some better results from drilling around hole ES-100.


I found this project very interesting to work with, the drilling has found two zones of gold mineralisation (East and West). Near surface the gold is relatively chaotically distributed (in narrow veins/structures) and at depth these high-grade zones appear to widen and are surrounded by a wide zone of low grade disseminated mineralisation.

We see our normal exploration company trick of grade expansion - increasing the average grade of wide zones by including narrow high grade intervals. This happens with frequency at Eastside, but Columbus have included a number of sections (link) that you can see what is going on.


Section 8900N
Zoomed in:
That 265' section really grades 0.31 g/t Au

So, here is the project in 3D (Columbus have a video here (link) - the interesting part is from 2:30 onward)


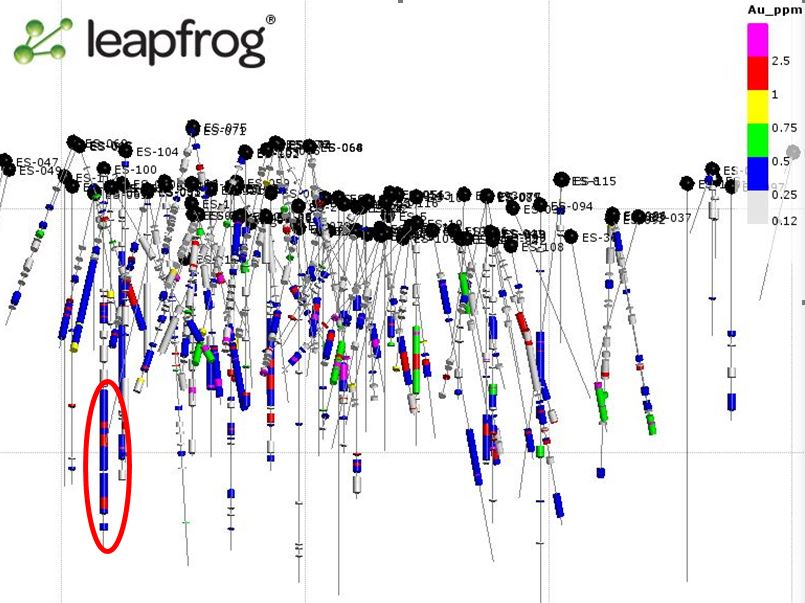
You can quickly see that the majority of the intercepts are less than 0.5 g/t Au (yellow) with relatively few high grade hits.


When you strip out the impact of the narrow high grade zones, the thick high(ish) grade zones disappear, We've gone from a nice, thick economic intercepts (for open pit mining) to low grade ore with thin, narrow high grade zones

Again you can download my 3D model here (link)

Just eye-balling the data, the majority of the mineralisation at Eastside sits between 0.25-0.5 g/t Au (for reference - Silver Standard are mining 0.45 g/t Au rock at Marigold), and when you couple that with the fact that the 'good' mineralisation appears to start at around 100m depths, it begs the questions, are the grades good enough to sustain a large pre-strip to get to some low grade material?

But it isn't all bad news. Drill-hole ES-100 intersected a thick zone of moderate grade rock (section 28740 - below).

Section 28740N
This zone has been poorly drilled, many of the drill-holes around this area were stopped before they could reach this zone, and one hole (ES-112 - results pending) was drilled to see if this zone continues to the south, but may be poorly located and could actually miss the target.
Maybe Columbus could see about extending drill-hole ES-103 by another 300m

I've going to keep my eye on Eastside, at the moment the drilling to date hasn't defined any decent grade mineralisation, but hole ES-100 offers some hope. If hole ES-112 is successful, this could be a project to key your eye on.


However, I did see some issues.

When you watch the video and spin around the data from Eastside (you can download my model from here (link) and open it up the the Leapfrog viewer), you 'll notice that the 'best' intercepts (the thickest, highest grade zones) appear to come from vertical drill-holes.


A series of structurally controlled gold zones with low grade halo?


This is typically where you have vertical mineralisation, a few holes get lucky and drill down a high grade zone and give great results, but often holes miss them and give you low grade (or nothing). I would like this zone to be drilled with some angle holes so to provide more info on the nature of the mineralization. Good rule of thumb - if a project has only been drilled by vertical holes, there will be issues.


I also noticed in the March 2015 technical report was the inclusion of metallurgical test results. This was surprising for a project with no resources, but it is good to have as you need to know if you can actually recovery the gold and silver. If the recovery is crap, it gives you an opportunity to walk away and spend money elsewhere.

It was stated that the recoveries were good, 94.8% for Au and 52.1% for Ag. That is excellent recovery for gold, and for silver, it is such a minor constituent, no-one really cares about it. If you look at the accompanying table (12.1 - page 48), you'll notice something.

Cast a quick look at the drill-intercepts figure above, you can see that the majority of the drilling intercepted grades between 0.25 g/t Au and 0.5 g/t Au. How many of the samples in the table above lie in this range?
The answer is 1 - sample 70908 - averaged 0.342 g/t Au. Every other sample (13 or 93%), can from material that was, in cases, significantly higher grade. This essentially means that the metallurgical results are useless. I would like to see the results from sample 70908 to see it its recovery is significantly different from the other samples as it is testing modal (the most frequently occurring) i.e. the majority of the mineralized material in the deposit. If the recovery for this grade material is poor, the deposit has no value.

Why is this important? I've taken some data from Gold Standard Resources Pinion project (link) to illustrate.


I chucked the numbers into Excel so we can see them visually.

As cut-off grades increase, number of indicated resources decrease.

This is logical, basically you have smaller amounts of higher grade material, and this means that a similar pattern is seen in the contained ounces.

Less tonnes (albeit at higher grade) = less ounces. At a 0.6% cut-off we reduce the ounces of gold by 38% and only 76,000 ounces (12% of the indicated resources) are found in blocks grading >1 g/t Au.

If we assume that a similar pattern is seen at Eastside, and just working with the subset of data that I got from their website, we can see that:
  • 51% of the assays are less than 0.25 g/t Au
  • 79% are less than 0.5 g/t Au
  • 86% are less than 1 g/t Au
  • only 6% grade > 2 g/t Au
If we ignore the samples grading less than 0.25 g/t Au (I'm assuming that this will be waste), we now see that:
  • 44% of the samples assay 0.25-0.5 g/t Au - 1 met sample (7%)
  • 29% grade between 0.5 and 1 g/t Au - 2 met samples (14%)
  • 14% grade between 1 and 2 g/t Au - 5 samples (36%)
  • 13% grade over 2 g/t Au - 6 samples (43%).
NOTE: my data is biased due to the over reporting of high grade intervals in the press releases.

So we can quickly see that there is an extreme bias in the metallurgical sampling. The majority (79%) of the samples test were from high grade areas which (using the Pinion charts as a guide) will probably form a minor (less than 15%) part of the deposit. If this company is serious about mining this deposit (at this stage they aren't), I would like to see a few more samples testing the average grade material.

I was a bit disappointed with the quality of data released to the public by Columbus. I identified numerous errors:
  • Incorrect distances (lots of typos and some unit conversion errors)
  • Average grade errors - several intervals gave me negative residual grades.
  • Incorrect drill-hole data in an earlier technical report table (reported earlier).
This may suggest a lack of attention to detail (i.e. rushing data into press releases), and they are probably just minor issues (my belief). However, it makes you think a bit more a dig deeper to see if this is actually a reflection on the attitude of the company when handling exploration data. I don;t think this is happening here, but is more common that you think, especially in Latin countries emphasis is put on data presentation (i.e. how "pretty" the logs are) rather than the importance of collecting high quality data.