Sunday, October 28, 2018

Garibaldi - fecked?

1.7m.....
1.7m.....
1.7m....

The height of a fridge, or Tom Cruise

That is the thickness of the New Central Zone (link) according to a nice clarification PR released last Thursday and still hasn't managed to make it to their website.

We got depths, thicknesses, and coordinates, but no map, or any trace of any news from any of the 18 drill-holes (hole 23-40) that must have been drilled between holes EL-18-22 (results released on the 24th Sept (link) and the new zone discovered by EL-18-41 (link)

However, they included some hole info for EL-18-41 so we can see where it is, and you can get the 3D viewer file from here (link)

Correction - I made a mistake in the original viewer file, I put the massive sulfide zone at the bottom of the lower disseminated zone not the upper one. The updated viewer file is here (link). Not much changes.


OMG!!!!!!!! To the shock of no-one, it's located where every other hole has been drilled.I'm guessing they used that cunning geologist trick "let's just turn the rig around and start drilling in the opposite direction"

I jest, the hole was drilled below a new zone of massive sulfide mineralization exposed by the retreating ice field (I've called it the Global Warming zone, and it is a much cooler name than "New Central Zone").

Here is a nice cross-section


You can see that hole 41 hit the massive sulfide almost vertically below the surface outcrop. If this is the case the true width could be a little as 0.5m. Another section


correct section below

The corrected section doesn't change much. The new zone is still narrow, but now 30m rather than 75m below surface, but not exactly open-pitable.

This is quite a busy section, but note:
  1. the massive sulfides in hole 41 are ~75m 30m below the surface outcrop of the Global Warming Zone
  2. Hole 41 appears to be also testing the NW continuation of the Main/Discovery Zone beyond hole EL-17-02, and hit nothing, not even a mention of disseminated mineralization (assuming that this zone is ~horizontal).
  3. In the surface map they talk about a MASU (MAssive SUlfide) bounders in moraine. If you look at the topography, you can see that the Massive Sulfide bounder zone is downhill from the Global Warming zone. This shows that this zone is the source of the bounders and it is unlikely to be anything huge beneath the ice in this area.
To reiterate a point, GGI were very quick at rushing out a PR based on visual observation of the core from hole 41, yet we've heard nothing, not even a mention of anything from holes 23 to 40, why? They are obviously a lot worse than hole 41 and must be shite.

Tuesday, October 23, 2018

Excellon - Platosa Resources

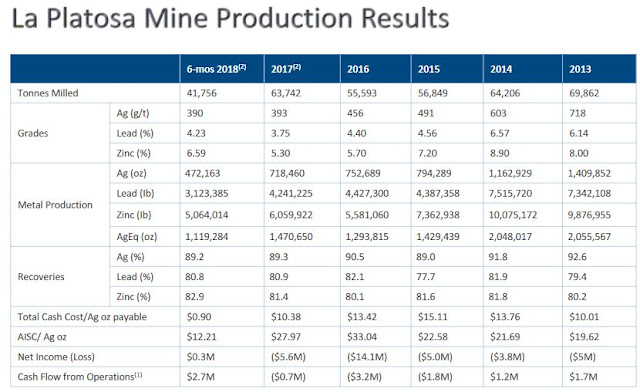
I have to admit, I don't like Platosa, I think it is crap. A deposit where too much money has been spent, it hasn't ever consistently been profitable, but people keep getting fixated on the grades and ignore everything else.

Excellon have trying to get Platosa to work for the best part of a decade. They've had problems with the unions, local communities, and water.

However, for me, the deposit's biggest Achilles heel is its size. Earlier this year we got the latest and greatest resources (link).


What is the correct word to describe them....


But unfortunately, with less boobs. Here they are....


Here are the resources from December 2014 (link).


Do you see how the M&I resource grades have plummeted from 2014 to 2018. I'm sure this is because the deposit has been mined very carefully and 3 1/2 years of very successful, profitable high-grade mining of a complicated deposit has taken its toll, but......


Ohhh, the production grades have been nowhere near the resource grades. The started off great, and then went on holiday.

continued mediocrity


the 2018 numbers look ok for the base metals
a general decline
Stupid question time - why is there a 6577 tonne (11%) difference between the SRK and Excellon production tonnages for 2017 (57,165 vs 63,842 tonnes)?

But for me, these are the funniest statistics


Wow, 10m drill spacing to accurately define the resources. I remember teasing Pretium about tight drilling.

Here it is visually (just for the mine area)

I wonder if the difference between resource and mine grade is because drilling has removed so much material
and this:


Holy Feck, you've drilled >358km (same distance Flint, Michigan is from Toronto) of drilling to have defined a total of  ~1.2 million tonnes @ 682 g/t Ag, 6.2% Pb and 7.4%Zn?
  • 498,000 tonnes of resources @ 548 g/t Ag, 5.6 % Pb and 5.9 % Zn
  • 696,469 tonnes produced @ 779 g/t Ag, 6.7% Pb and 8.5% Zn

Or to put it another way. Excellon have mined and defined:
  • 1,194,469 tonnes grading 1287 g/t AgEq, or 49,458,316Moz AgEq
  • Drilled 358,070 meters
  • So this works out to a success rate of 138.12 oz AgEq per meter
If we compare that with Silvercrest's Las Chispas project we see:
  • Total drilling 83,230m
  • Total resources: 86,701,200 oz AgEq
  • Success rate = 1041.7oz AgEq per meter
I'm being crude as Las Chispas is all inferred resources, but this is the reason I think that Platosa is crap and why I have shares in Silvercrest. Platosa is too fecking hard.


Monday, October 22, 2018

GT Gold Corp - Back in the Saddle

That teaches me for not paying close attention to the market, a spectacular rise in GTT.V share price after some juicy porphyry hits at Saddle North.


Obviously, you can remind me of my terrible comment from my last post (link).

I suck..
So, we'll ignore the drilling at the Saddle deposit, the market doesn't care about these, and focus on the porphyry.

You can get a Leapfrog viewer file here (link) to look at it in 3D-goodness.

At the moment it is early days, we have the data from 3.5 holes (hole TTD062 stopped before hitting the guts of the porphyry), so it is hard to know the full scale of the mineralization (this is me covering my ass), but the IP data may give us a hint.

I'm ignoring the mag data as it doesn't really help us (there is a huge anomaly), but the IP data may give us a potential size of the porphyry system.


and a close up...


It looks like the copper mineralization is found in a 500m long by 200-300m wide zone. From the sections, this zone dips to the SW, and may also dip to the NW (based on the fact that the Western n changeability high associated with the pyrite halo is more subdued, suggesting that it is at greater depth).

I'm also intrigued by the fact that in none of the literature do GT Gold mention any bornite, just chalcopyrite and pyrite. At another small porphyry deposits in the area we see this:

Bornite in the middle like jam in a donut
The best grades are found in the core, which often a lot of bornite, as we see no mention of this, there is a good chance that they still haven't drilled it. My guess is that it will be found to the west of hole TTD092.

Circle marks the spot..

When I look at the Saddle North Plan map (link), I noticed that a couple of the drill-holes, TTD098 and TTD107, don't appear to be optimally located. They appear to be targeting the pyrite halo and may only hit erratic, low-grade intervals (<0.25% CuEq with narrow zones of ~0.5% CuEq).


However, I'll be very interested to see what hole TTD102 gets, this could hit the bornite core and could get some decent, thick intervals of high-grade (>1% CuEq) mineralization.

I'm also interested in hole TTD106, if this gets grades similar to TTD085 (100+m @ >0.3 g/t Au and >0.3% Cu), this would be very positive as when you look at the sections, you can see that the highest grade mineralization starts at ~400m depth.


Is this potentially too deep?

Wednesday, October 10, 2018

Pretium - Brucejack Q3 Results

Pretium published their Q3 results yesterday (link), and as they are at a steady state in the Brucejack operations, why don't we compare the number to previous quarters.

Au Production


a miss is a miss
Production dropped by 18,700 ounces compared to Q2, 2018 (a 17% drop). This was because:

Au grade


Yup, you've guessed it, we see a corresponding drop in Au grades from 14.9 g/t Au in Q2, to 12.4 g/t Au in Q3. This will always be an issue in high-grade operations due to the nugget effect, where you expect to see +/- 20% changes in production, but over the long term these swings should balance out.

However, if Pretium continue to struggle to make the grade (this is 4 times out of 5 that they have missed), it will put pressure on their resource model.

Recovery


Still great, nothing to worry about here

Mill Throughput


The mill has very slightly under performed, but again, not a significant issue.

So this is again another quarter where Brucejack hasn't hit the expected production outlined in the PEA, they were down 17%, but management is staying positive!


So, to hit that target they need to produce in Q4, 2018:

  • 107,359 to 127,359 ounces of gold by....
  • maintaining a head-grade between 14.4 g/t and 17 g/t Au


Thought for the day:
If Brucejack had met the production profile in the PEA (i.e. a 'perfect' operation), it would be producing ~120Koz a quarter. Since the start of the year, Brucejack has produced ~75,000 ounces less than predicted in the FS.

I'll let you work out how much that is worth..

Sunday, October 7, 2018

Ivanoe - Makoko-loco

Ivanhoe have been finding massive amounts of copper in the DRC at Kamoa-Kakula, but they've just announced a new discovery (link) Makoko.

It was great that they included most of the drilling data in the press release, and from that I have been able to model the mineralization (Leapfrog Model here):

I've also used the data to come up with a resource guesstimate.


Not in the same scale as Kamoa, but a start.

Assumptions: These are based on the data used in the Kamoa PEA


Cut-off: 1% Cu

Specific Gravity: 2.8 to 2.9 depending on the Cu grades (the more Cu, the higher the SG)

Search Ranges: 

  • 800m (Kamoa PEA) but 
  • I've also included a 1600m range to match the 'limits' used in the various maps that are found on the Ivanhoe website.
You can clearly see that there is a core >4% Cu Zone that appears to be truncated by the Mafic intrusive, but, several wide-spaced holes (>500m apart) appear to show the >2.5% Cu mineralization extending to the SE.


Unfortunately, there appear to be some post-mineral mafic intrusions that appear to truncate the down-dip extension of the >3% Cu mineralization. The  good news is that the at the eastern and western limits of the drilling they are still intersection >2% Cu mineralization over moderate thicknesses (2-5m).

Mafic units in green - I'm assumed that they are approx. vertical cylinders, which is probably wrong 
It will be interesting to see if the Cu horizon continues beyond the intrusions, but if it does, it will be at ~700m depths. There have been a few holes drilled up-dip, but they have returned intervals grading <1% Cu.

Green Unit = Mafic intrusion; thin red unit = Cu bearing horizon.

However, I'm going to guess that my 'estimate' will be low. I've made a few annotations on the plan map above where there is a bit of "artistic license". You'll see how the influence of the low grade intercepts are being reduced to cause the smallest of ripples on the sea of high-grade mineralization that Ivanhoe want to show. It will be interesting if this 'interpretation' continues into the initial resource estimate or if the holes are treated a but more equally.


correction: it should read 800m DIAMETER around each DH