I've ignored Brucejack for ages, but why don't we return to an old favorite.
Since I last put out a post we've had 3 quarters of production and a new resource calculation.
Reserves and Resources
Why don't we compare the Reserves and resources for Valley of the Kings (VoK)*.
Original Dec 2013 resources
Updated April 2019 resources
*the West Zone resources hasn't been updated and isn't the current focus for production.
There are some slight differences
Tonnage
Reserves stayed about the same, M&I resources dropped by 10%, which is isn't much when you see that they mined >1.5Mt of ore (to end of 2018) since the 2013 Feasibility Study. However, we do see a big drop in inferred resources.
Headgrade
This is where things get slightly less polite.
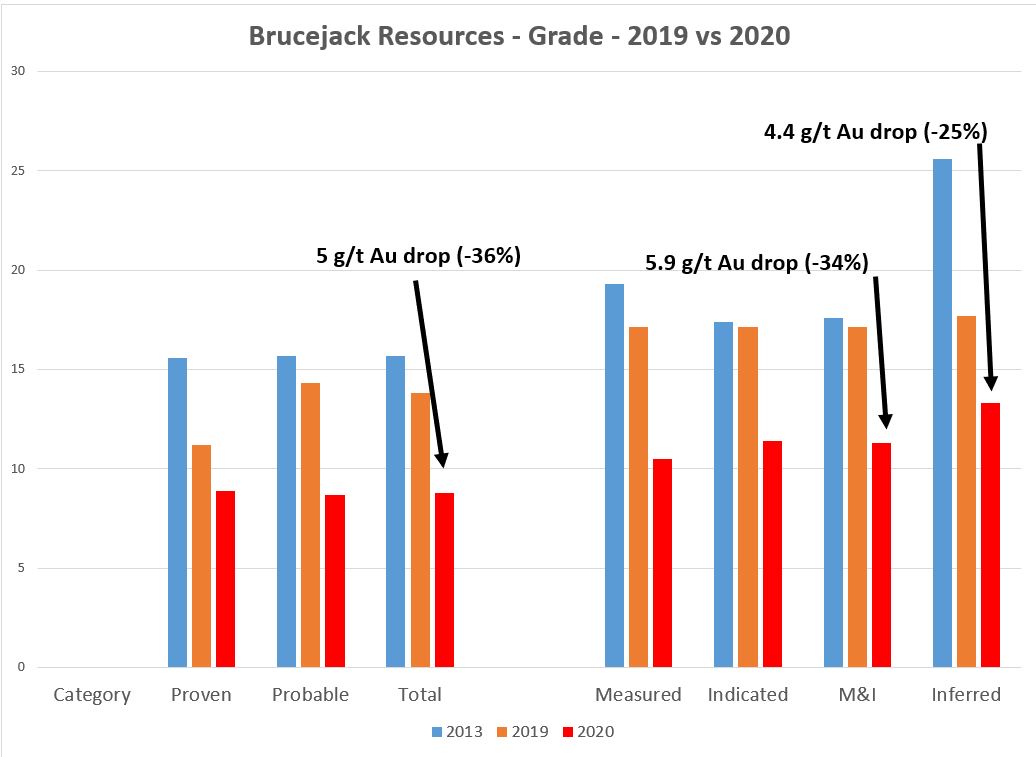
We see a moderate drop in head grade for the Reserves, a slight decrease for M&I resources, but a big drop in inferred grades.
We can't say this is due to Pretium mining high-grade ore in 2018 as the average head-grade for 2017 and 2018 was only 10.1 g/t Au.
Contained Gold
These changes in tonnes and grade have had a big impact on the contained gold.
Even is we take into account that the mine produced ~0.5M oz in 2017 and 2018, that is a massive decrease in resources, they have lost nearly a quarter of the contained gold at Valley of the Kings.
The question is - is the deposit intrinsically hard to model accurately (yes) or was the 2013 model overly optimistic (yes) and didn't fully understand the control and distribution of the gold.
2019 Production
This is easy, production to date is below expectations, even Pretium cut their 2019 outlook from 390K-420K oz Au down to 340K-350K (40K-80K or ~20%), which caused a nice share price collapse.
So why don't we have a look at the wreckage...
Here is the April 2019 LOM grades by year...
 |
| We're still in 2019! |
Tetratech tell us that Pretium will be mining ore that is 10.6 g/t Au in 2019
Pretium actually mined.....8.9 g/t Au
But they did get better, cranking the grade from 8.7 g/t Au in Q1 to 9.1 g/t Au in Q3.
Awesome job!! Just 1.7 g/t or 16% below expectations.
From their pessimistic production outlook (slashing production by ~60Koz), we can have a go at estimating the Q4 numbers.
We can calculate the planned Q4 production
- Est. Annual production - 340-350Koz or 345,000 (taking the mid-point)
- 2019 production to date = 258,168 oz
- Q4 production = 345,000 - 258,168 = 86,832 oz
We can try and calculate the average head-grade
Assumptions
- Mill throughput = 3600 tpd (still ramping up to 3800 tpd)
- Recoveries 97%
Tonnes milled = 3600 x 90 = 324,000 tonnes (assuming 2 days of shutdown)
Ounces produced = 86,832 x 1.03 = 89,437 (removing the 3% loss in the mill)
Q4 average head-grade = (89,437 x 31.1)/324,000 =
8.6 g/t Au
Even if Pretium hit the upper end of the estimated production, the grade only increases to 9.1 g/t Au.
The mine is very productive and highly profitable, but it is still under performing, by 10-15%, its new and improved feasibility study, that dropped the grades significantly. What is interesting for me is that since commercial production began, the mine head-grade has sat stubbornly around 9 g/t Au. Is this the 'real' grade of the deposit?
One observation I had in an earlier post was that I was concerned that as the mill was expanded, we would see a drop in head grade.

There is a trend suggesting that, but I think it is a bit too early to tell.
I know this post is a bit negative, but the mine has consistently failed to meet expectations, I know that I will receive a lot of posts saying that the share price is up, but the rise in gold to US$1500/ounce has helped to mask some issues with the mine.

It is still a fantastic mine, and I'm sure that once the issues are resolved, or at least understood, an if gold price keeps creeping up, I would expect a major company to look very hard at buying Pretium.